Current Weather Data
Here you can view recent data collected at ICOS Sweden stations. The figures are generated automatically based on raw data, which means that the values have not yet been quality controlled. Note that not all variables are measured at all stations.
Sorted per station from north to south. Click on the station you want to see and choose time frame.
The eddy-covariance fluxes are raw data calculated by the Swedish National Network. Data are displayed without further quality flag filtering.
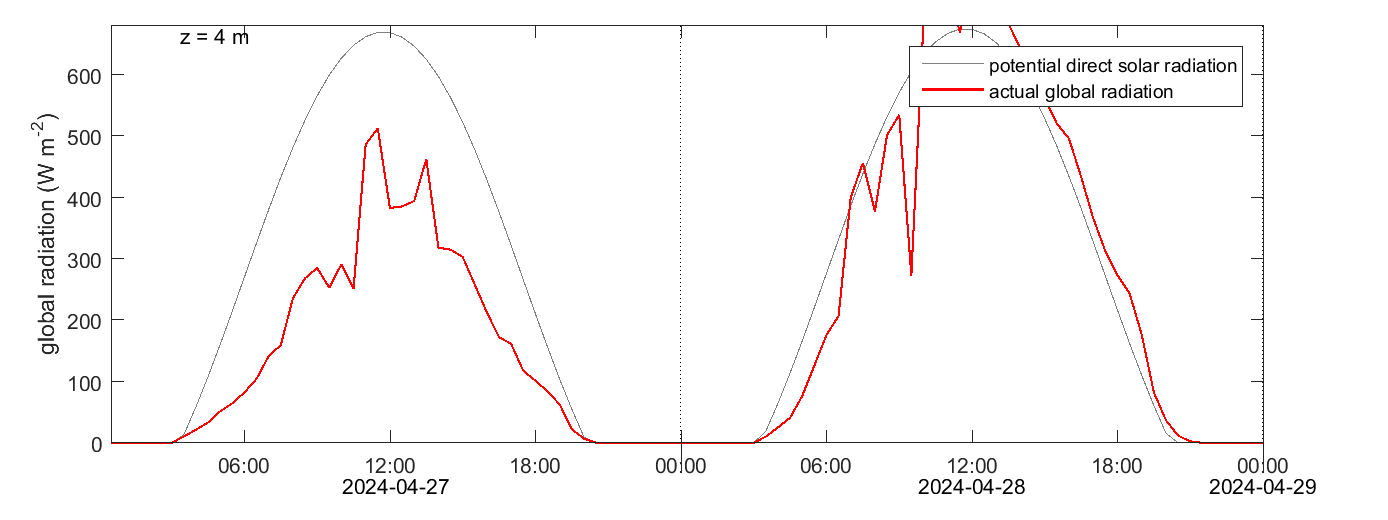
solar radiation
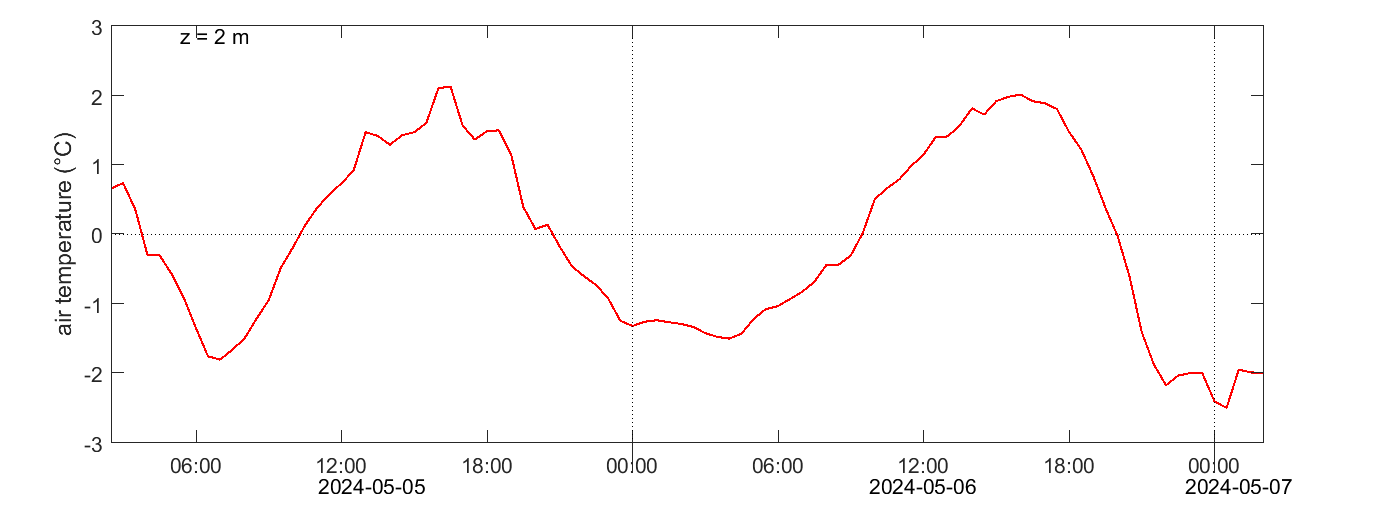
air temperature
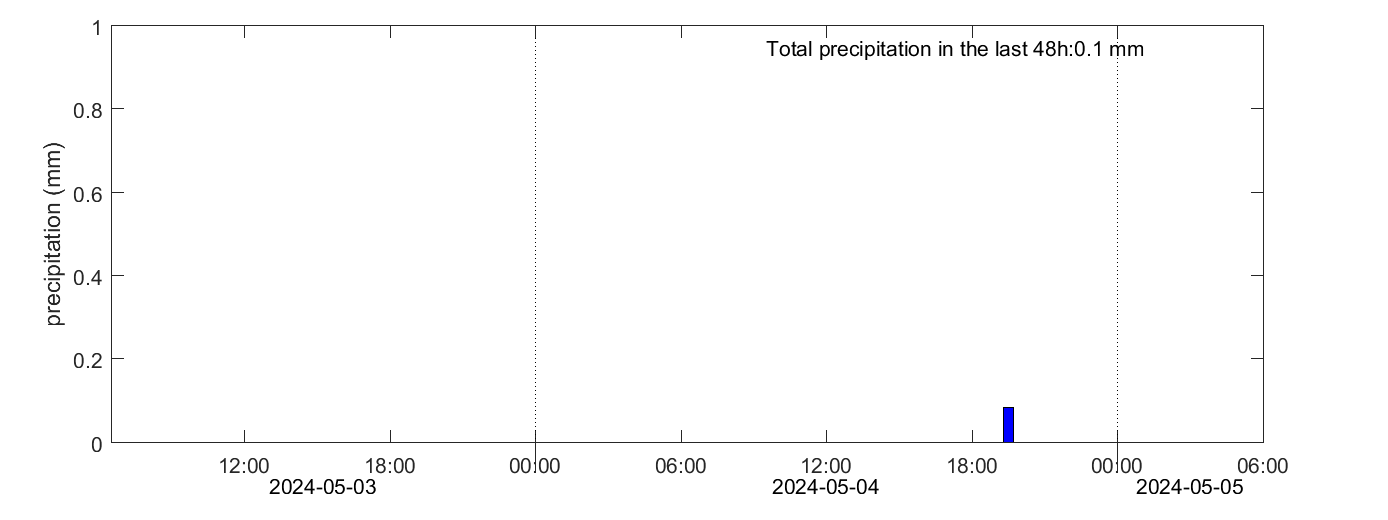
precipitation
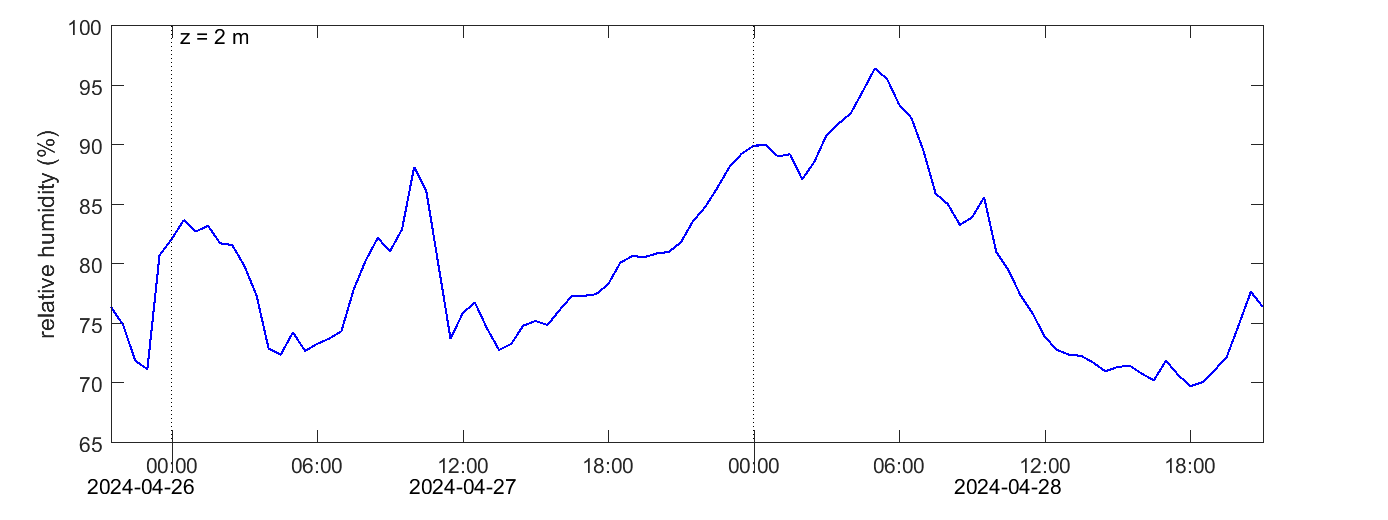
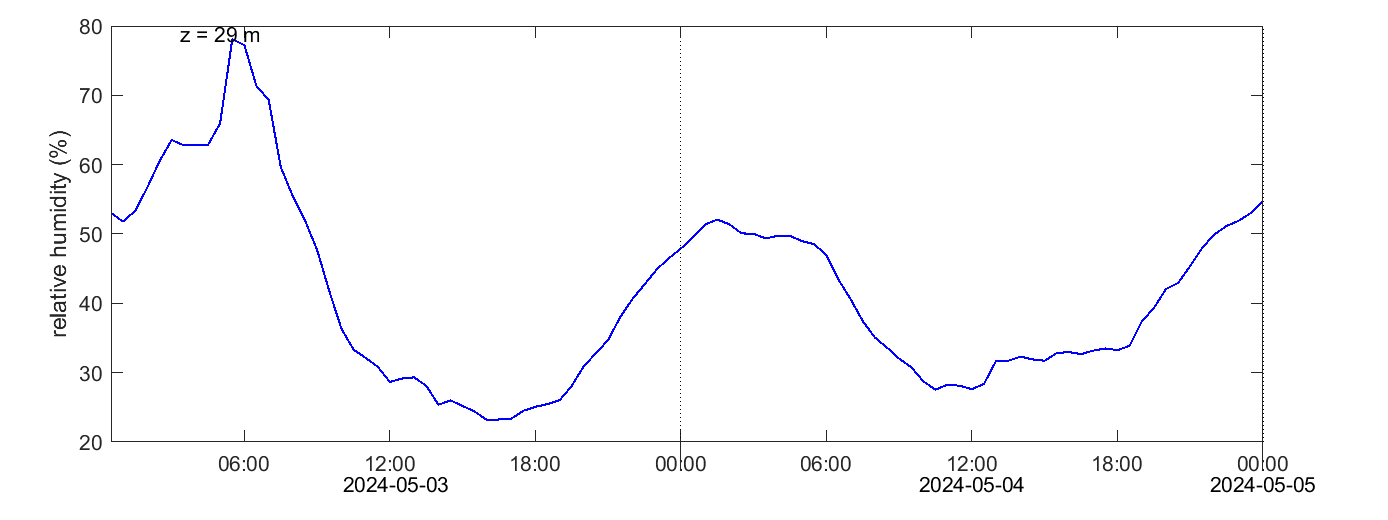
relative humidity
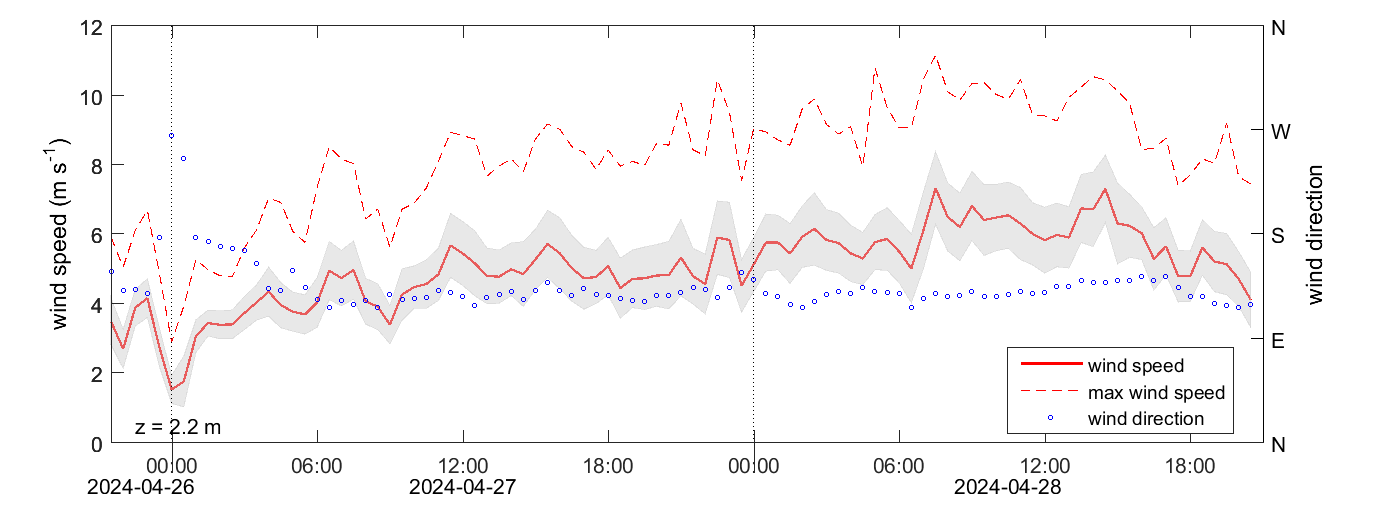
wind speed and direction
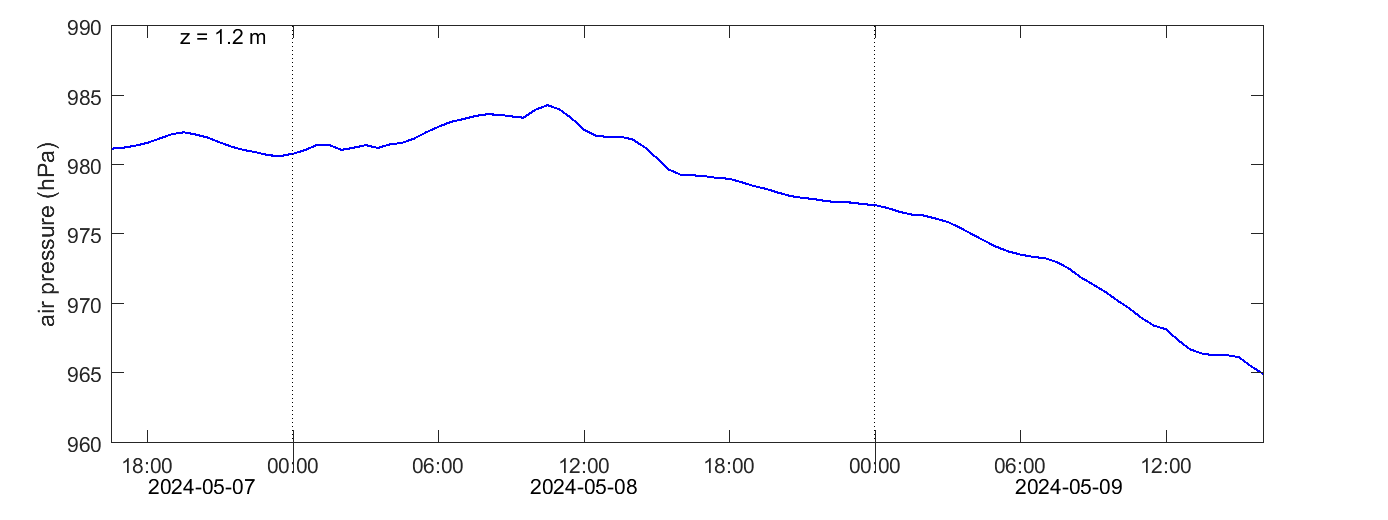
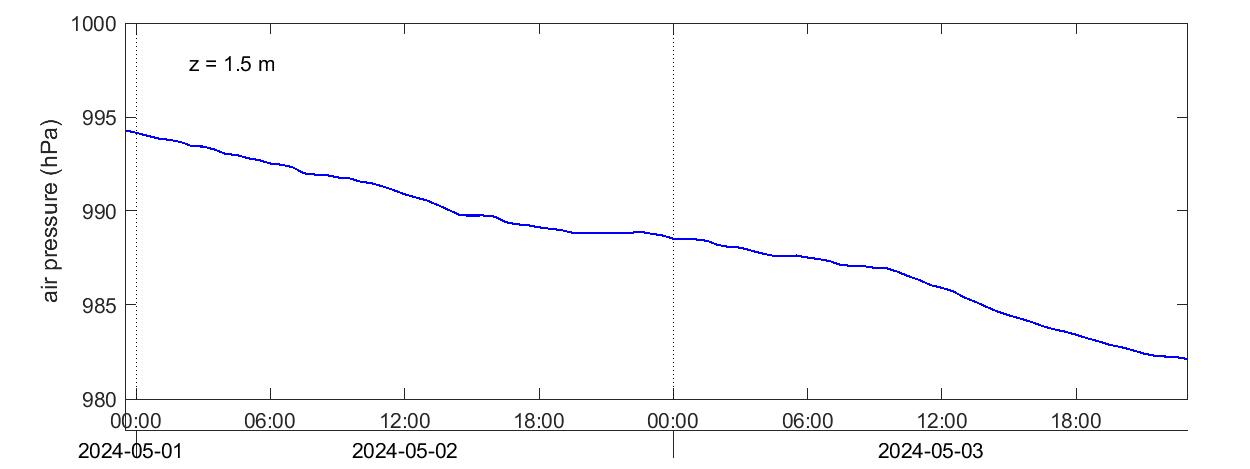
air pressure
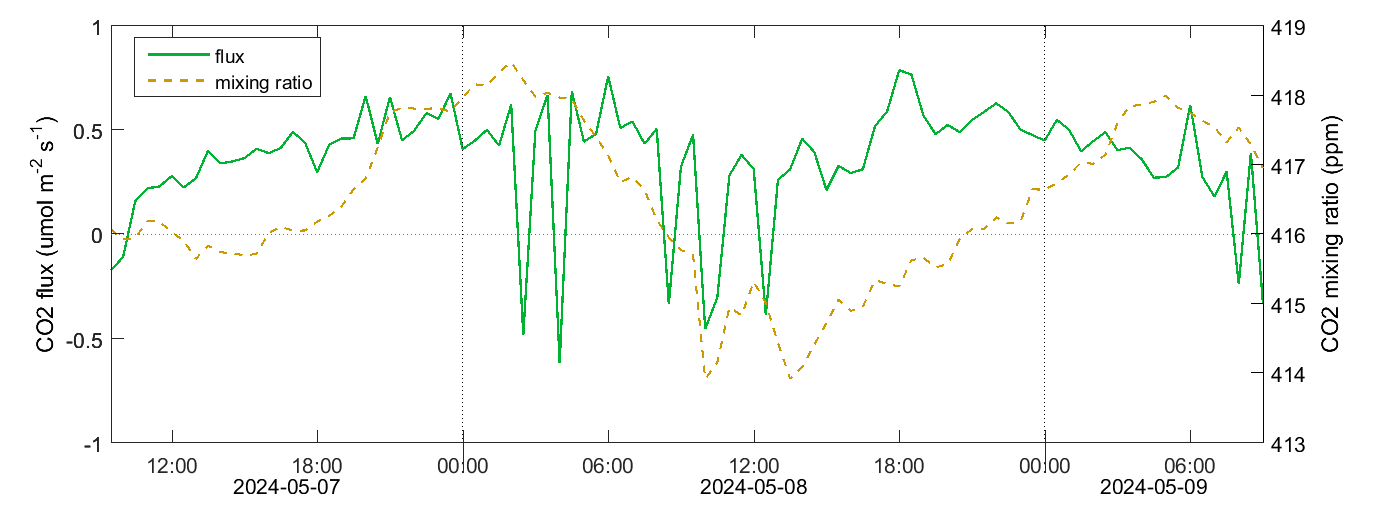
CO2 flux and mixing ratio (LI-COR)
The eddy-covariance fluxes are raw data calculated by the Swedish National Network. Data are displayed without further quality flag filtering.
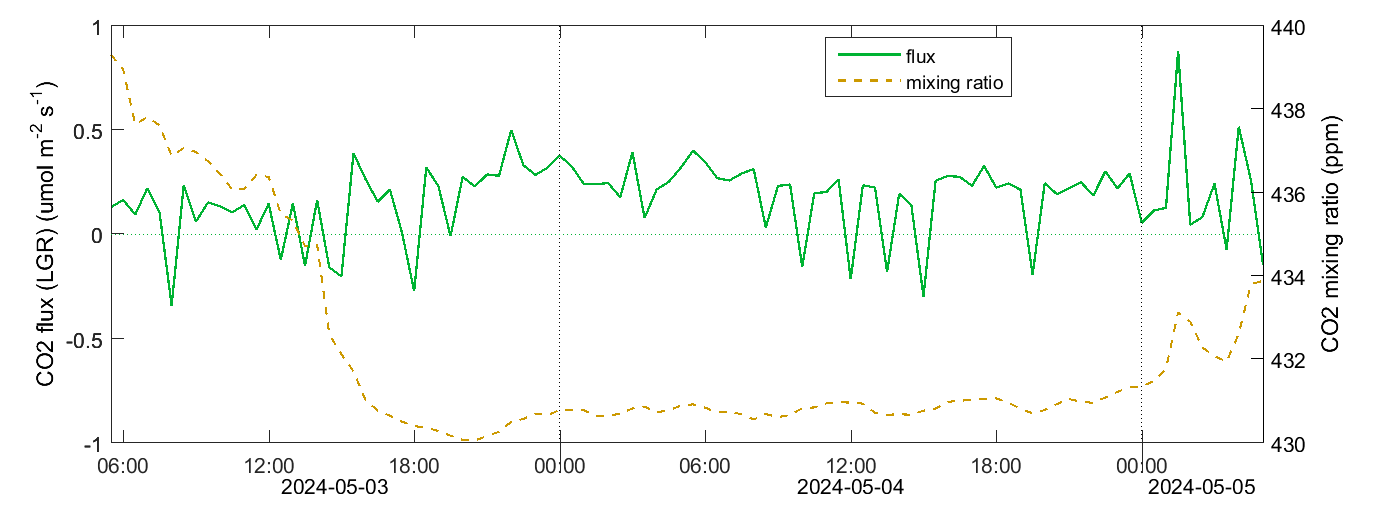
CO2 flux and mixing ratio (LGR)
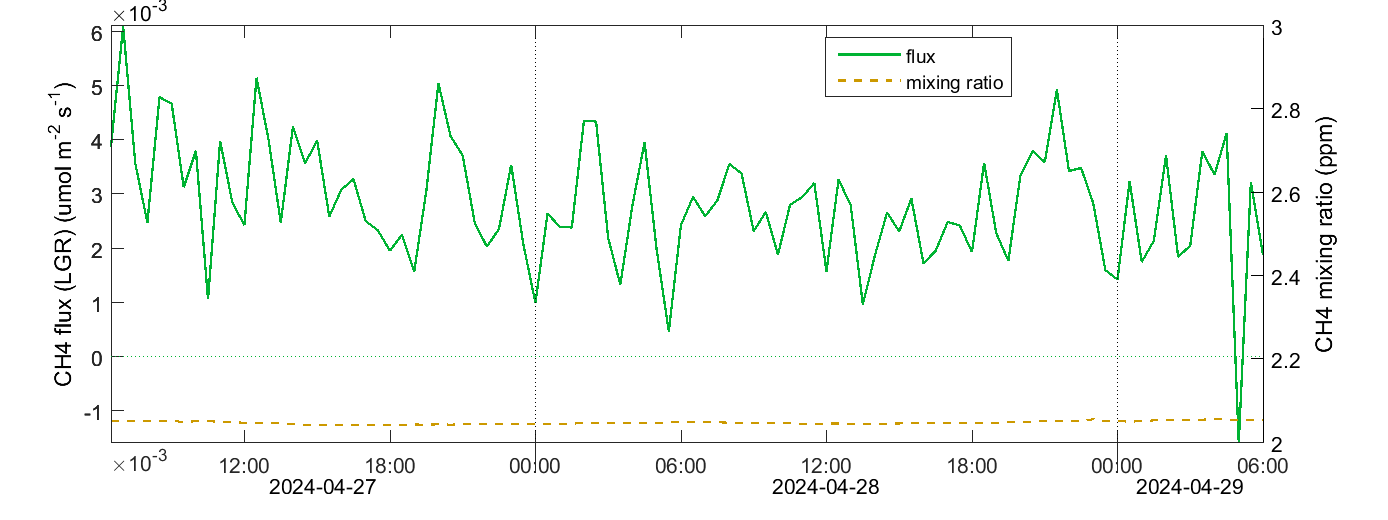
CH4 flux and mixing ratio (LGR)
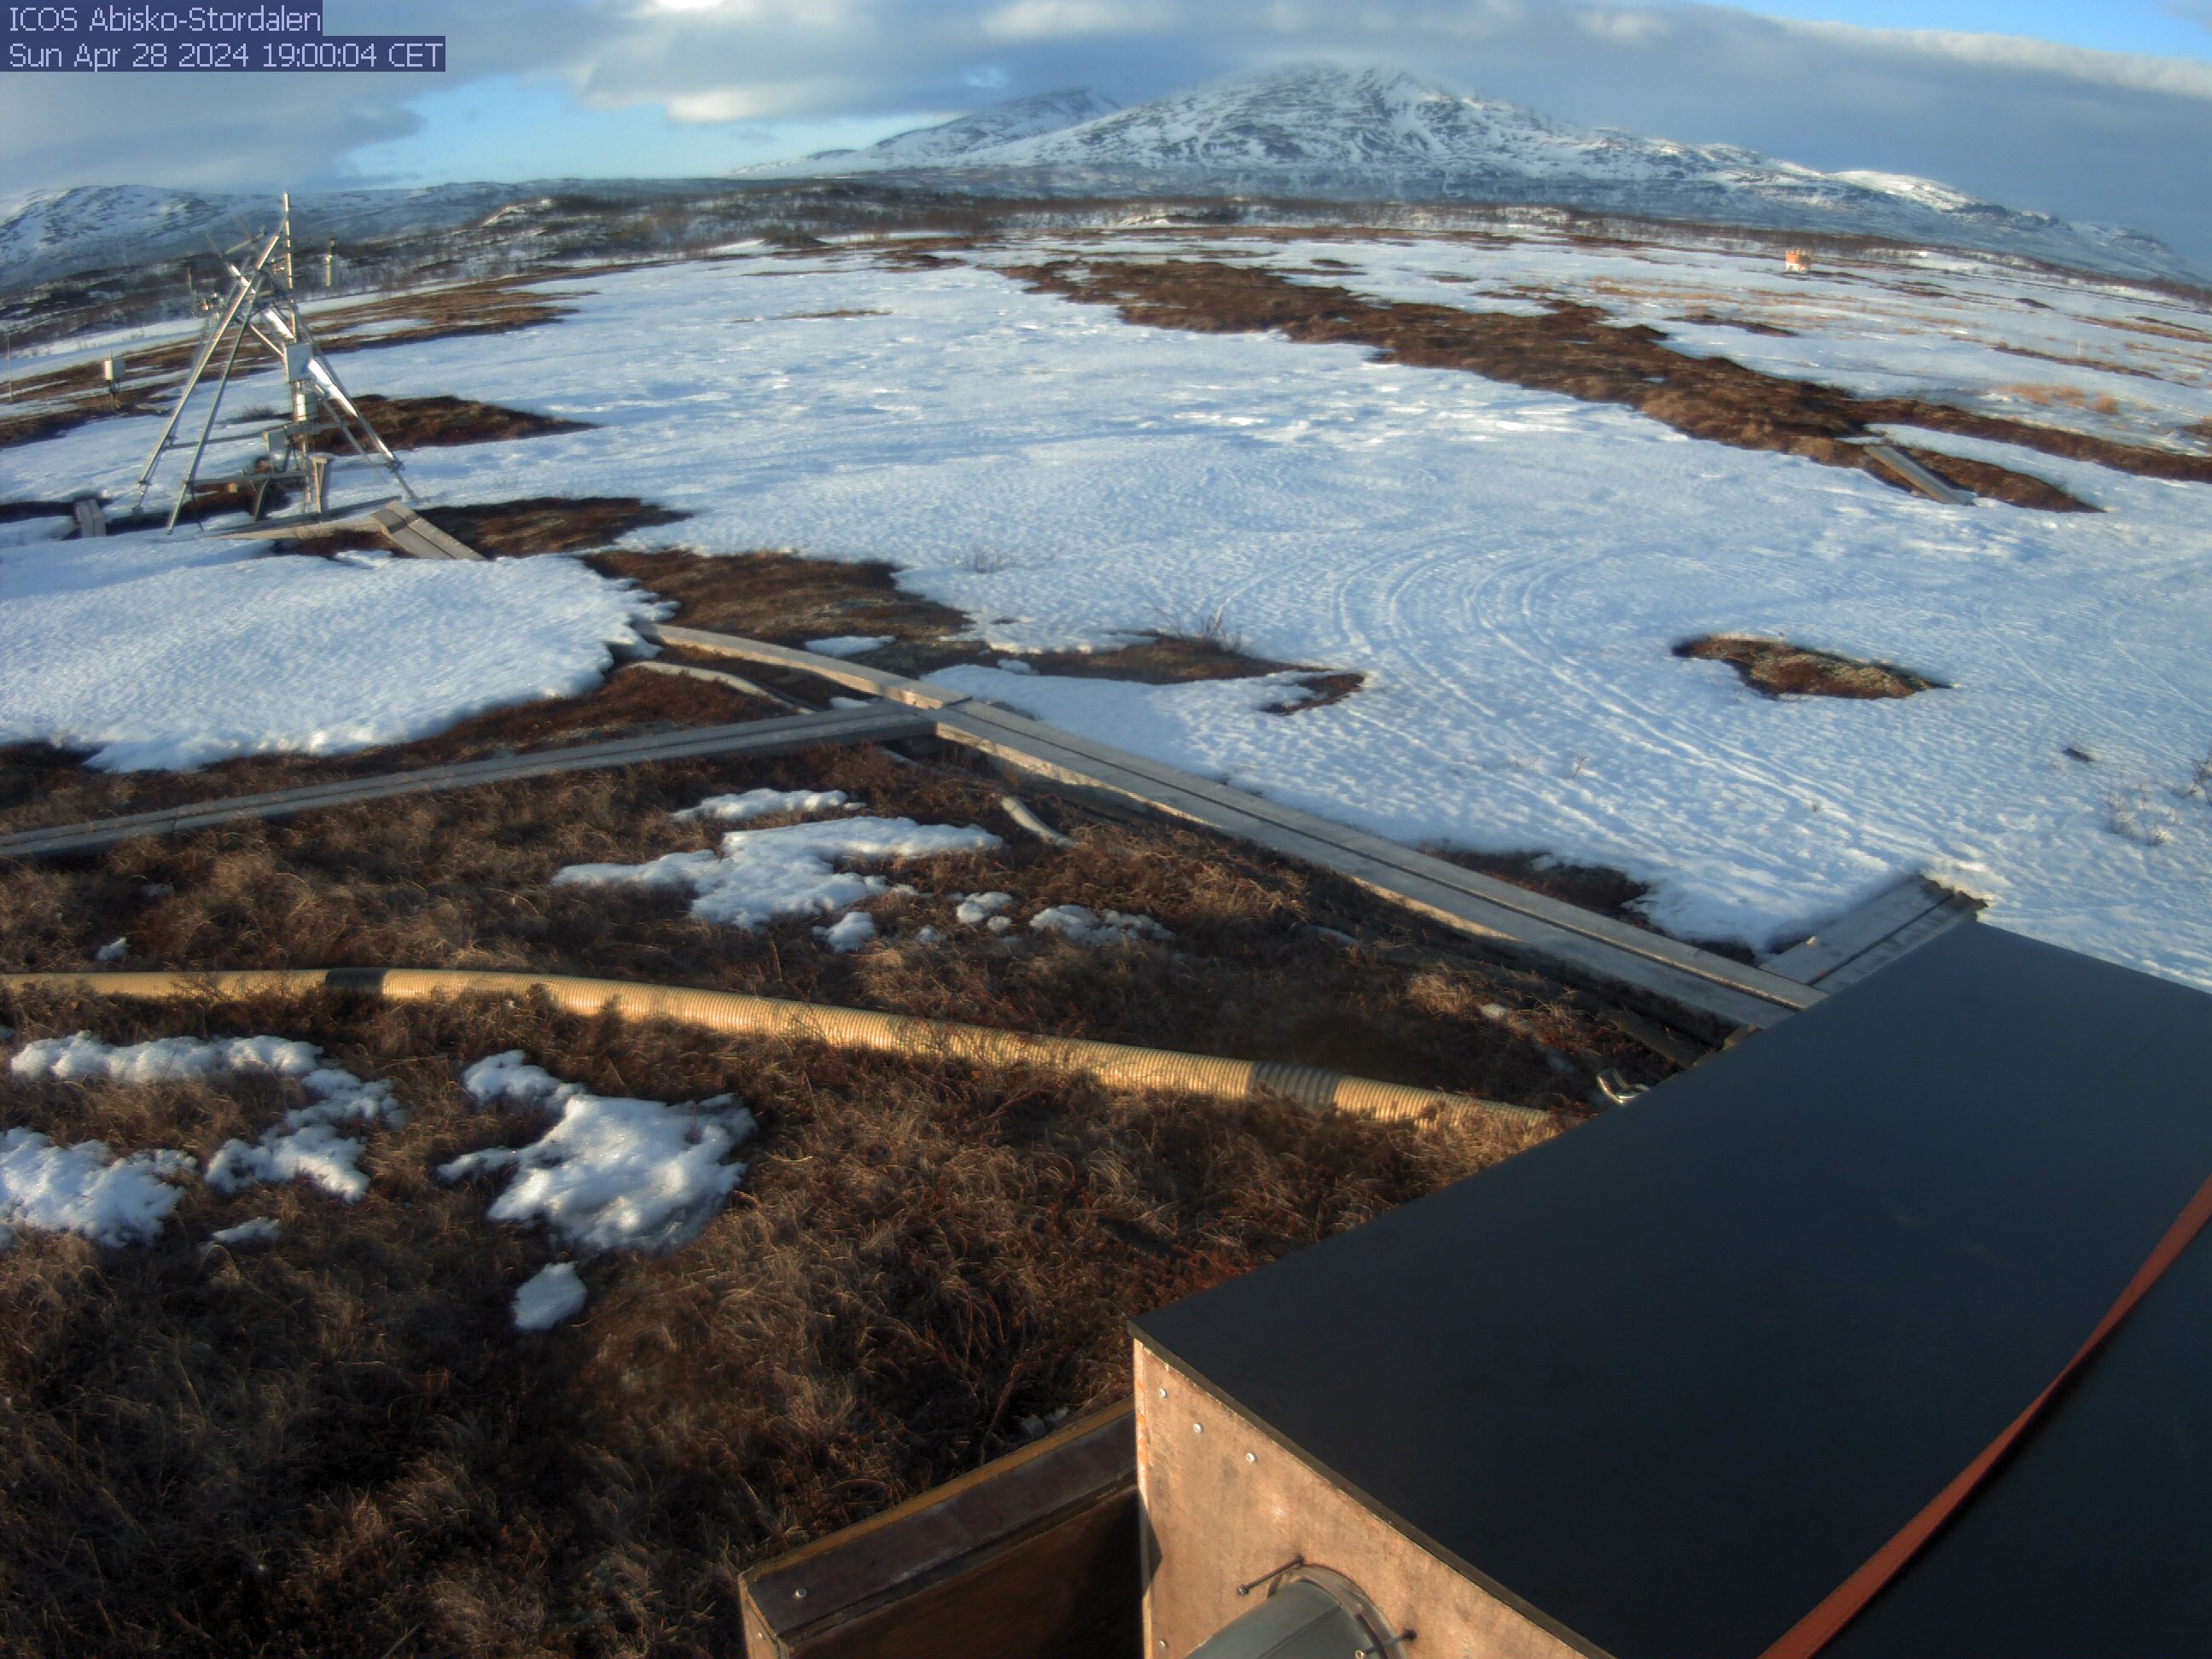
phenocam
Abisko-Stordalen | ||
|
The eddy-covariance fluxes are raw data calculated by the Swedish National Network. Data are displayed without further quality flag filtering.
solar radiation
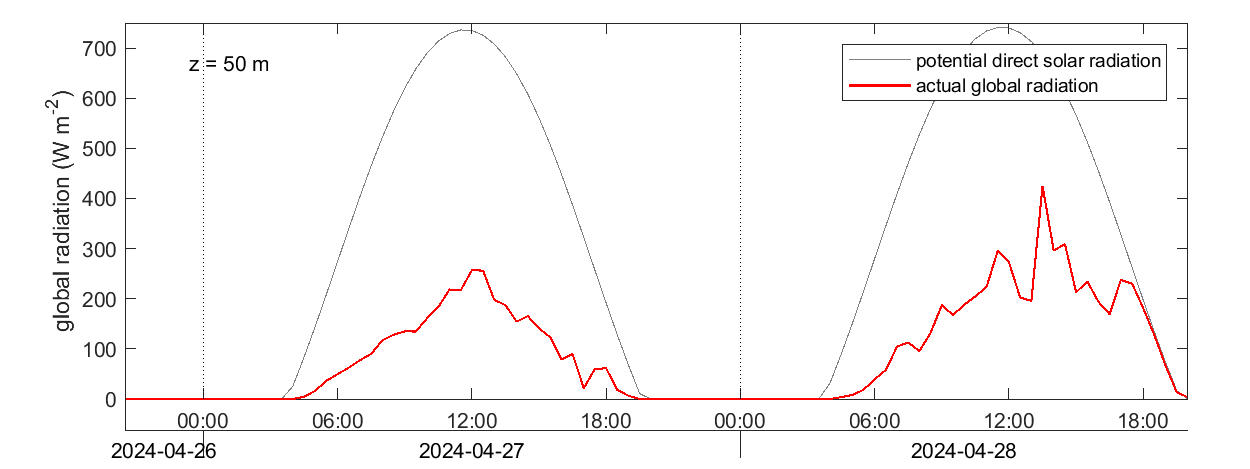
air temperature
precipitation
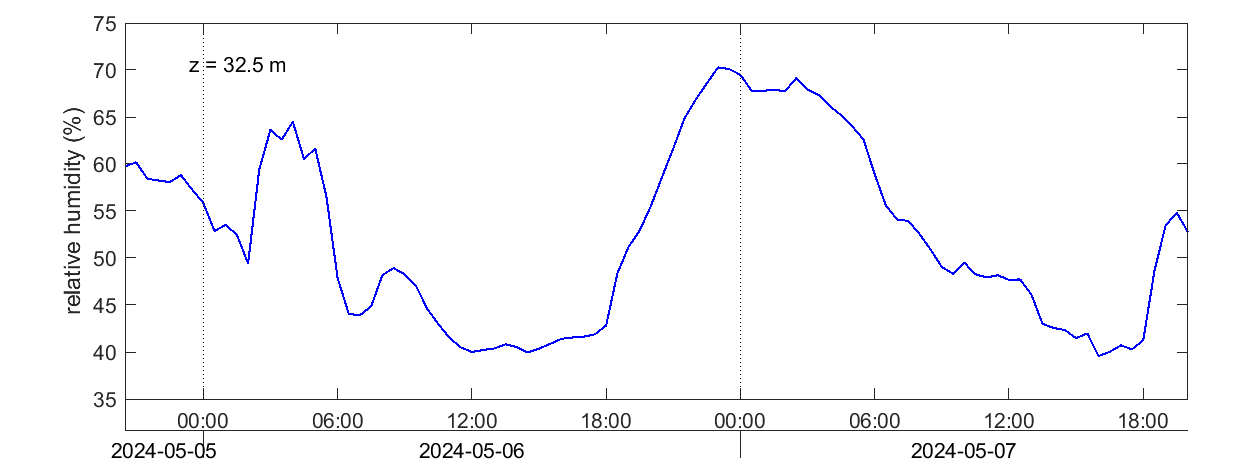
relative humidity
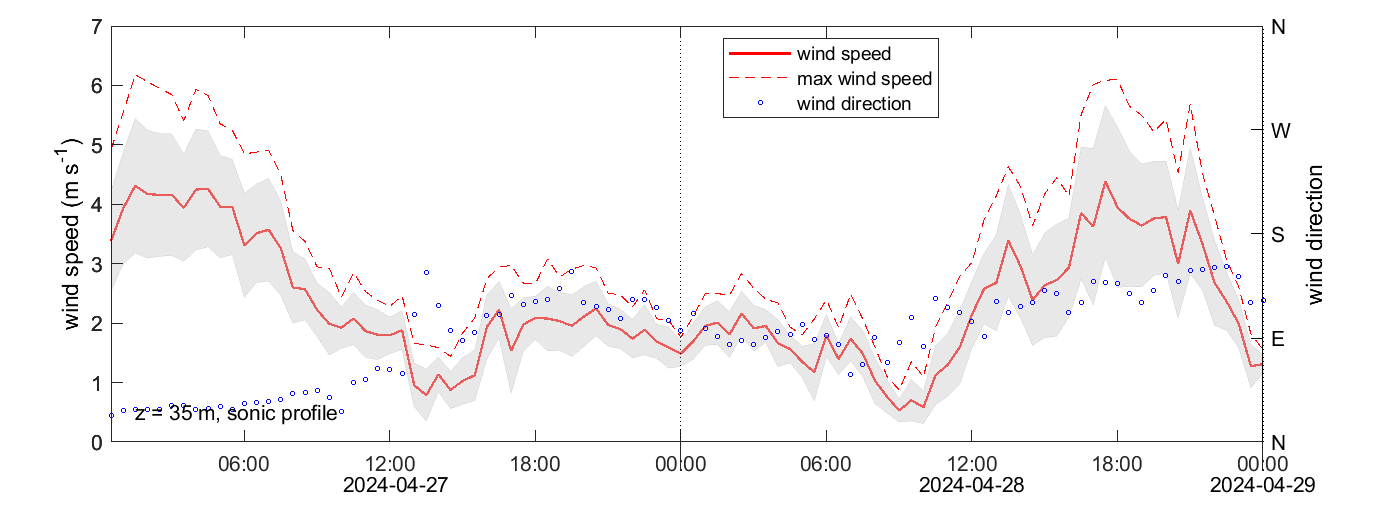
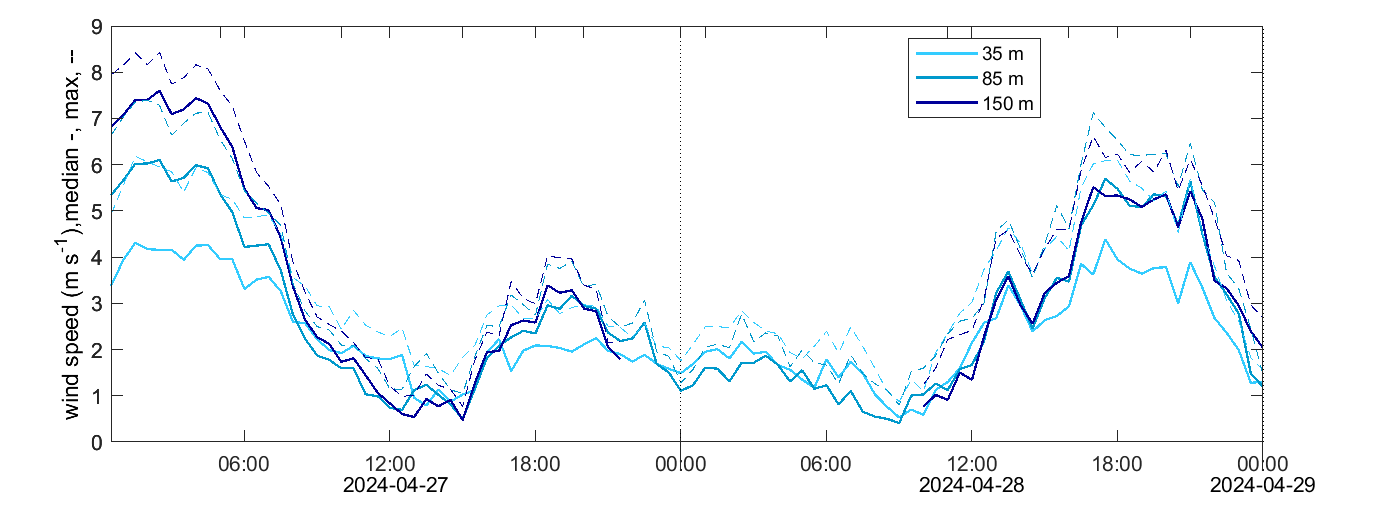
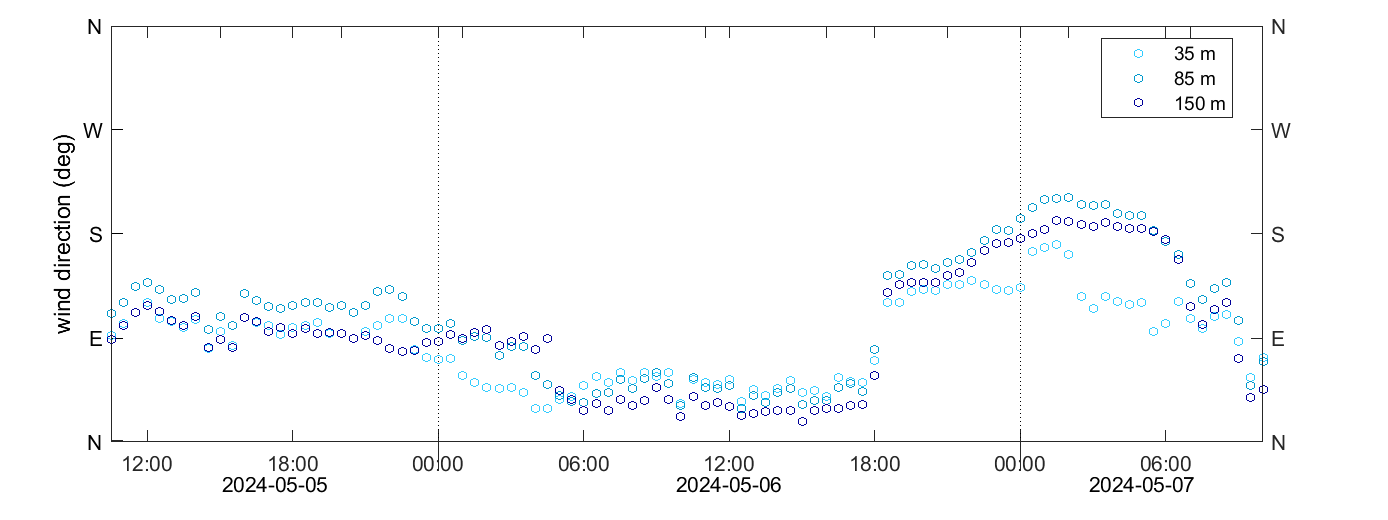
wind speed and direction
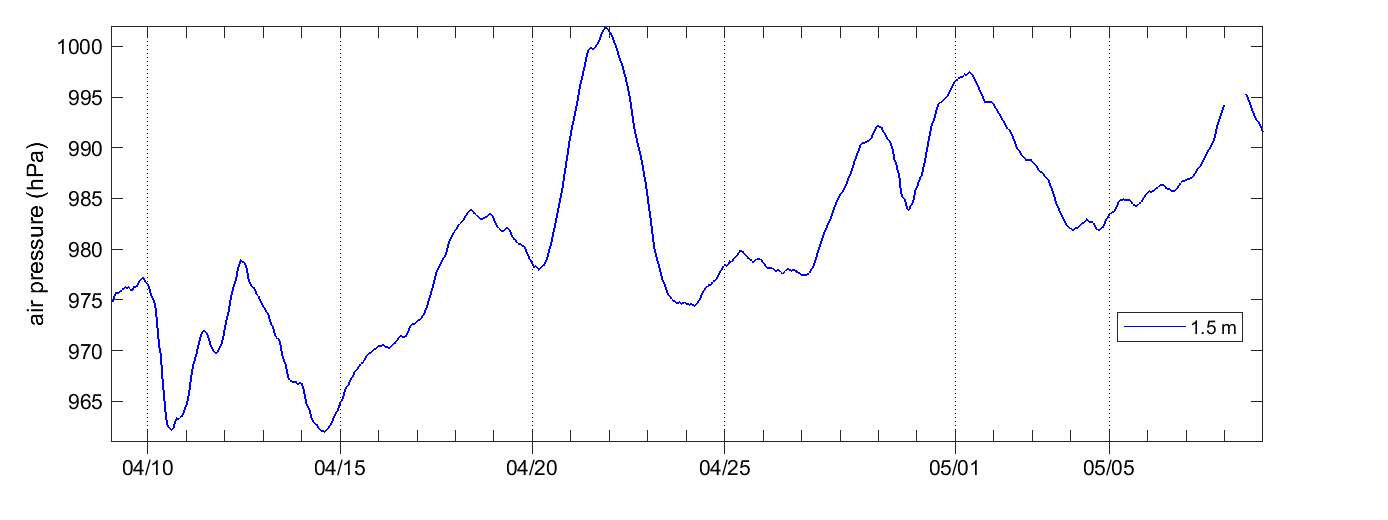
air pressure
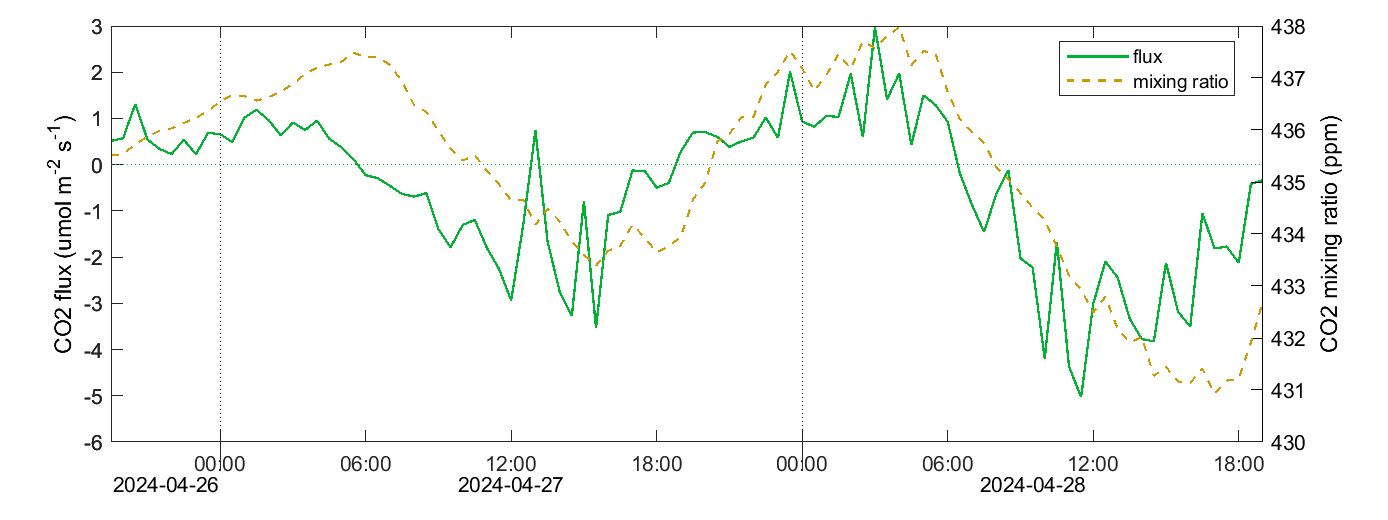
CO2 flux and mixing ratio
The eddy-covariance fluxes are raw data calculated by the Swedish National Network. Data are displayed without further quality flag filtering.
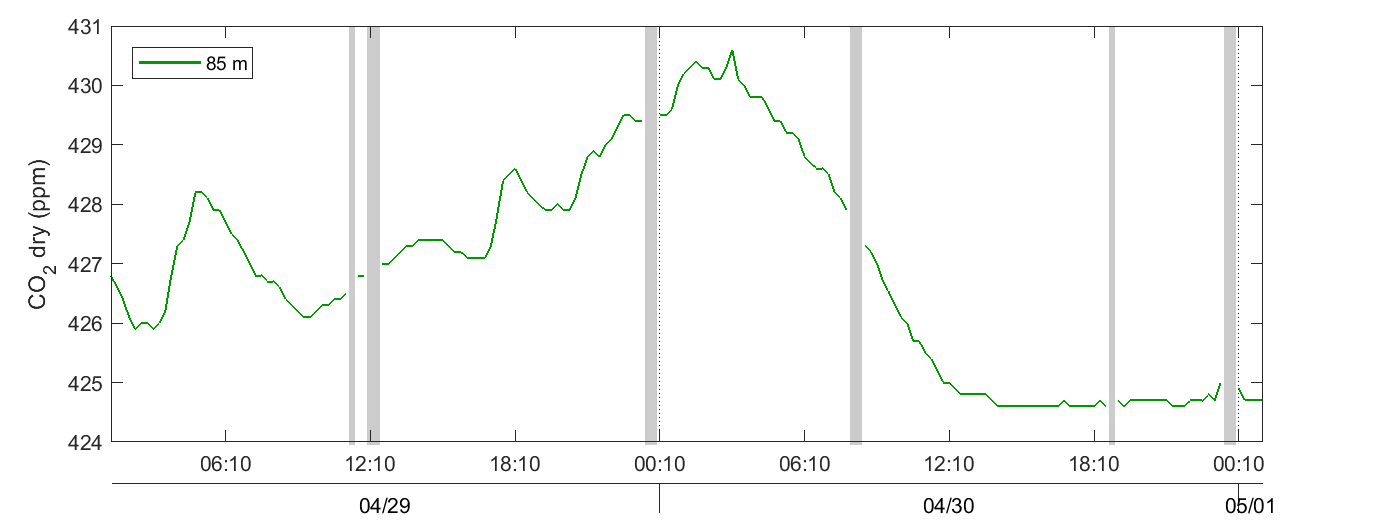
CO2 concentration
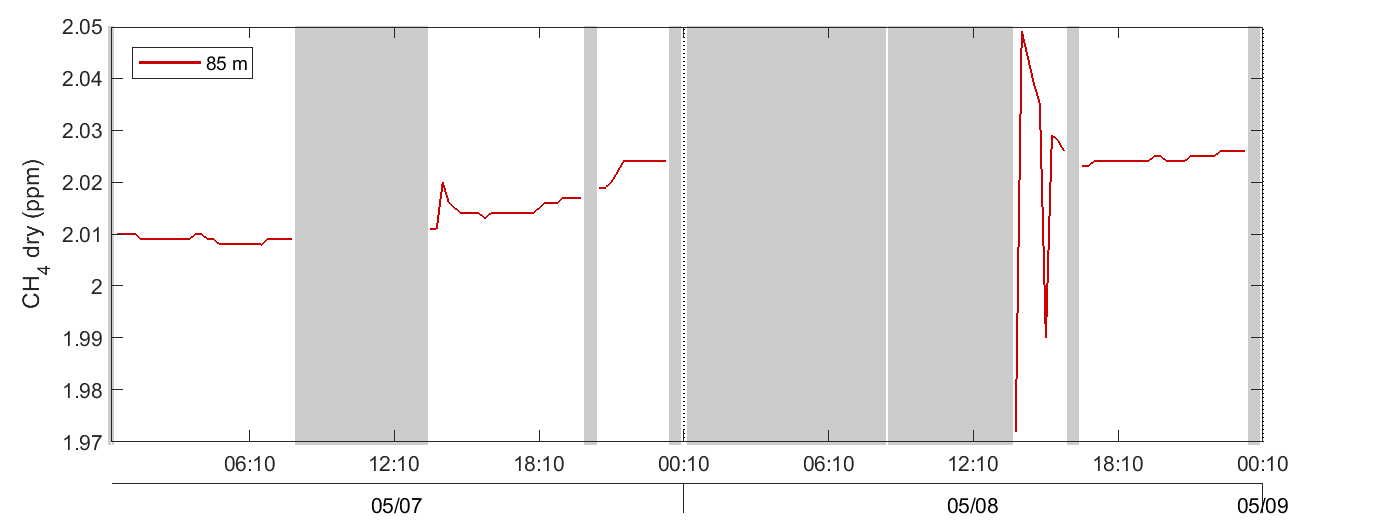
CH4 concentration
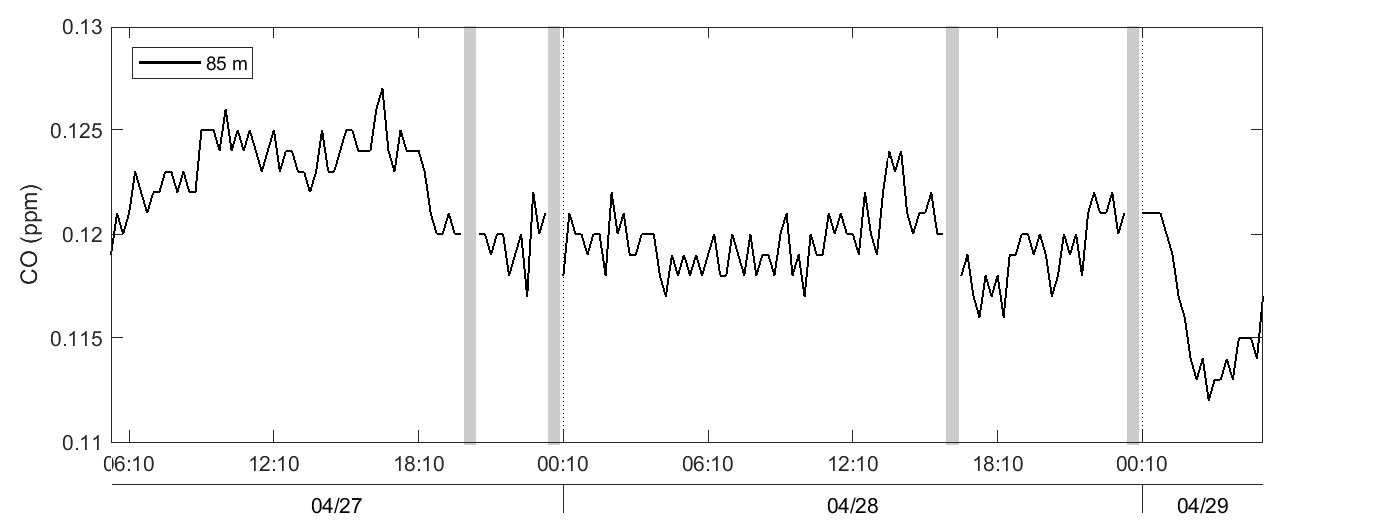
CO concentration
phenocam
Svartberget – Above canopy | Svartberget – Below canopy | |
|
|
The eddy-covariance fluxes are raw data calculated by the Swedish National Network. Data are displayed without further quality flag filtering.
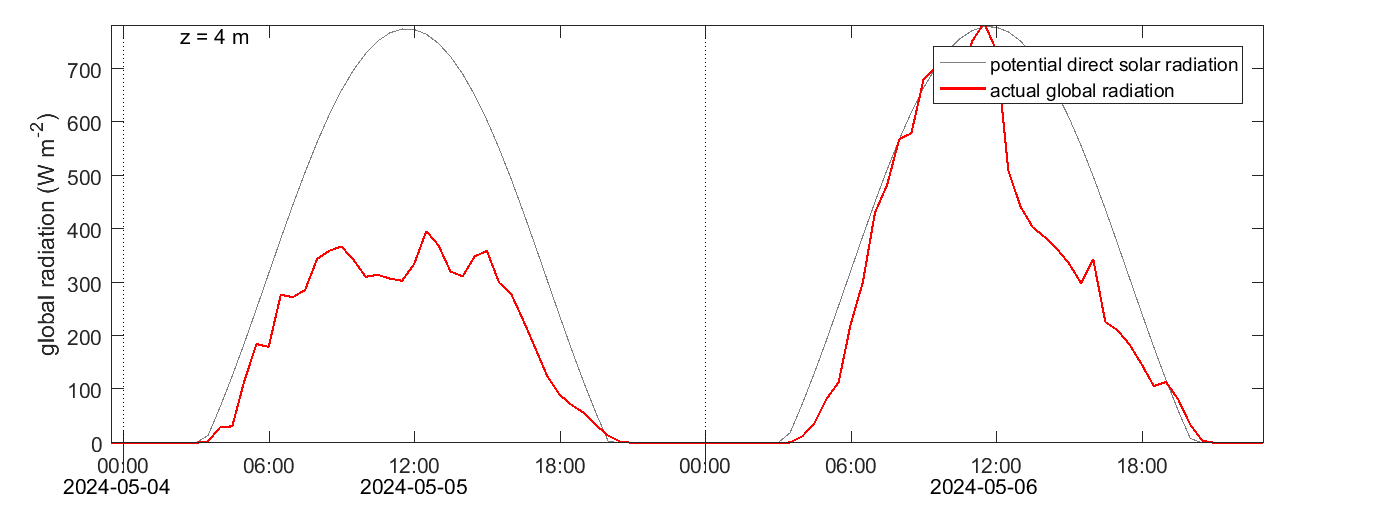
solar radiation
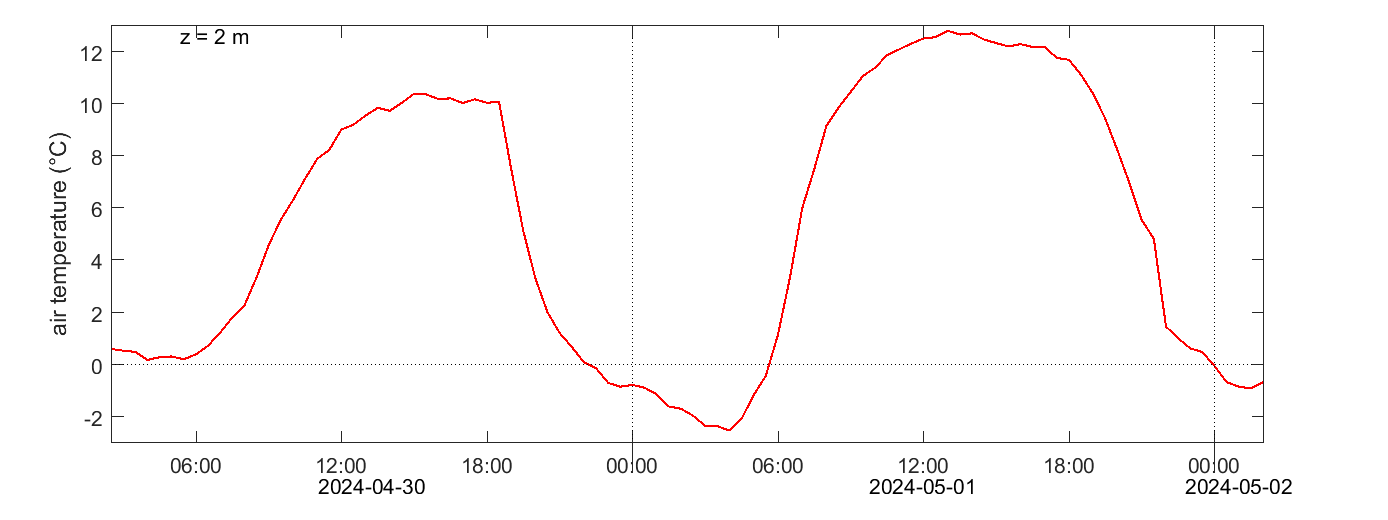
air temperature
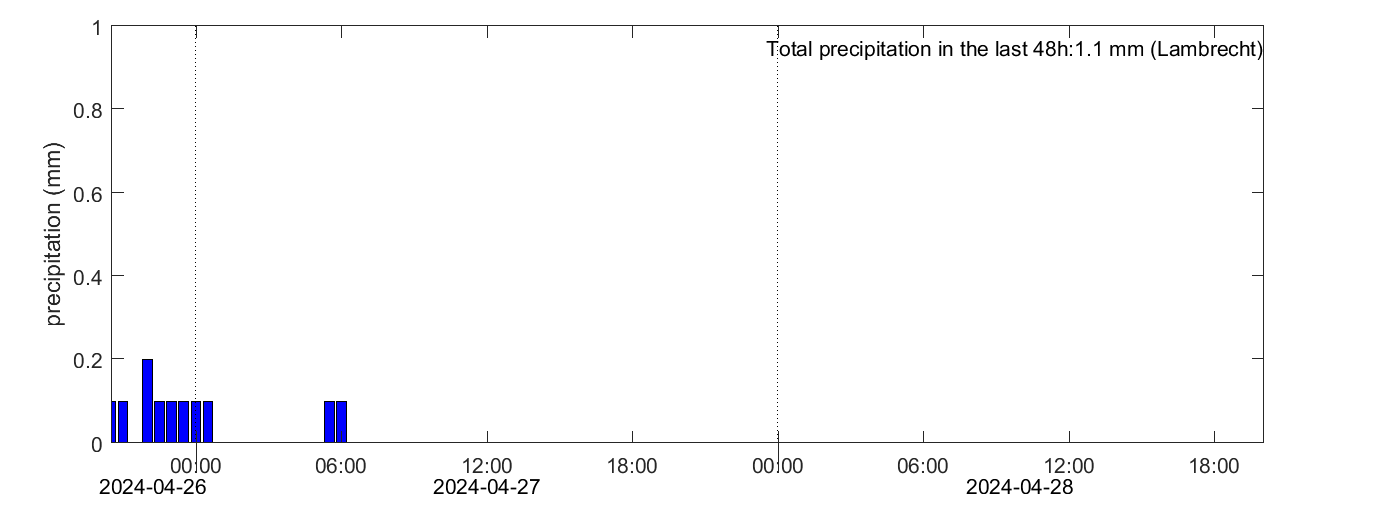
precipitation
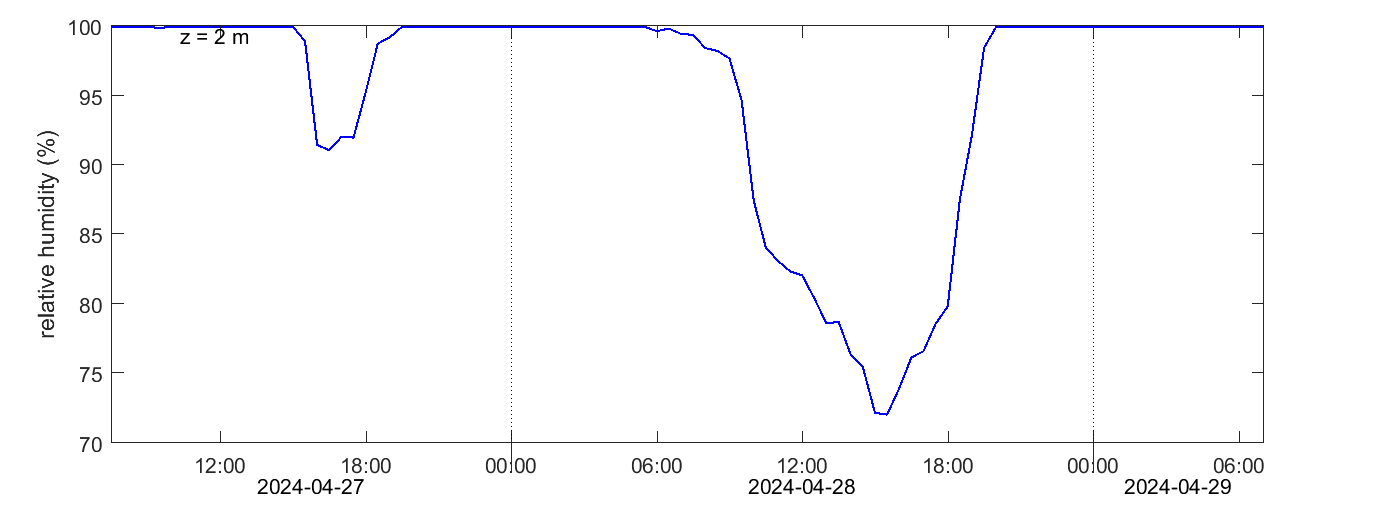
relative humidity
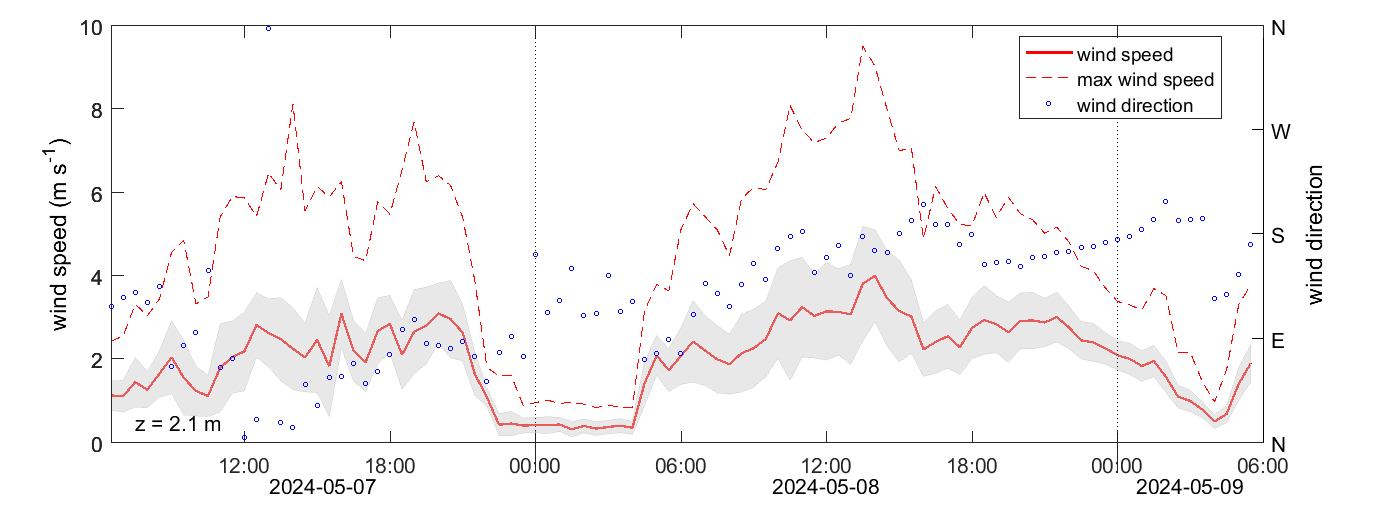
wind speed and direction
air pressure
currently no graph available
CO2 flux and mixing ratio (LI-COR)
The eddy-covariance fluxes are raw data calculated by the Swedish National Network. Data are displayed without further quality flag filtering.
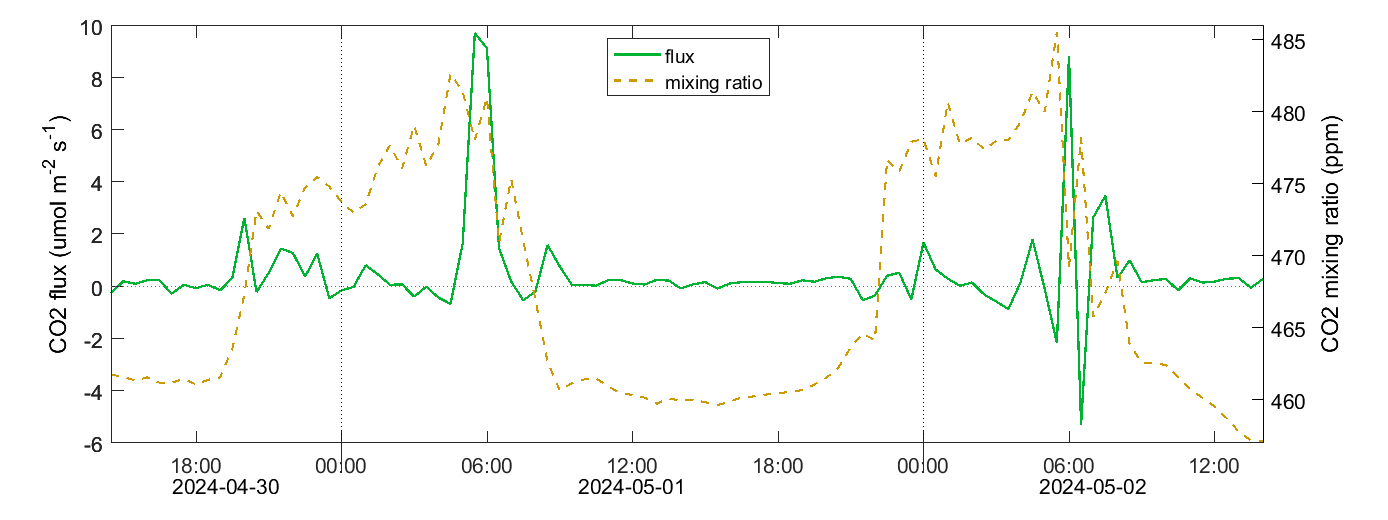
CO2 flux and mixing ratio (LGR)
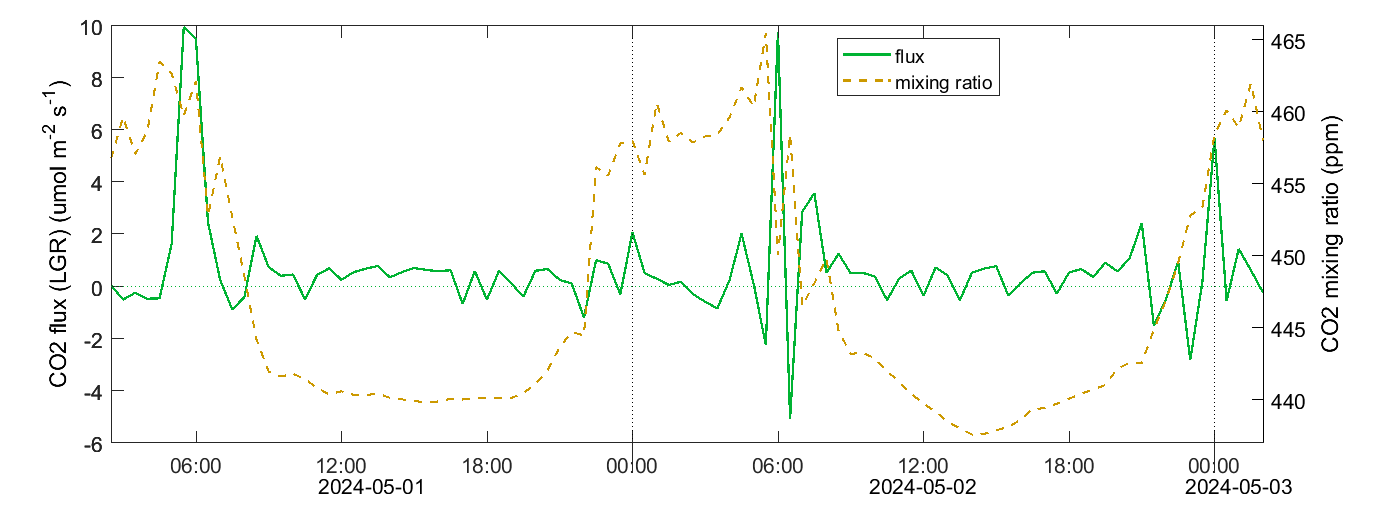
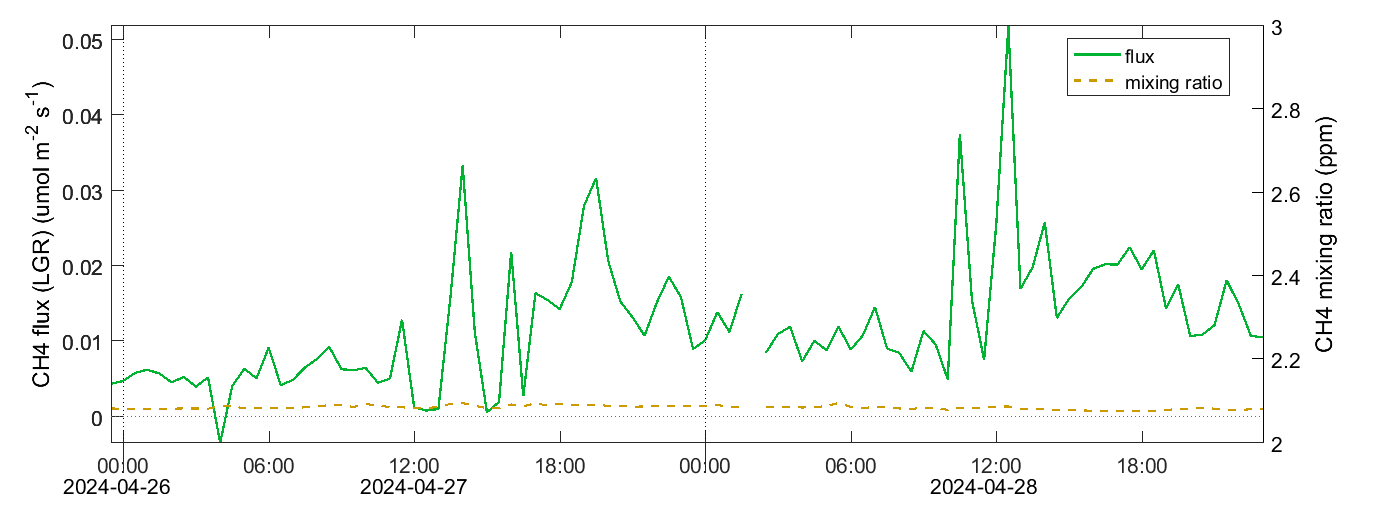
CH4 flux and mixing ratio (LGR)
phenocam
Degero | ||
|
The eddy-covariance fluxes are raw data calculated by the Swedish National Network. Data are displayed without further quality flag filtering.
solar radiation
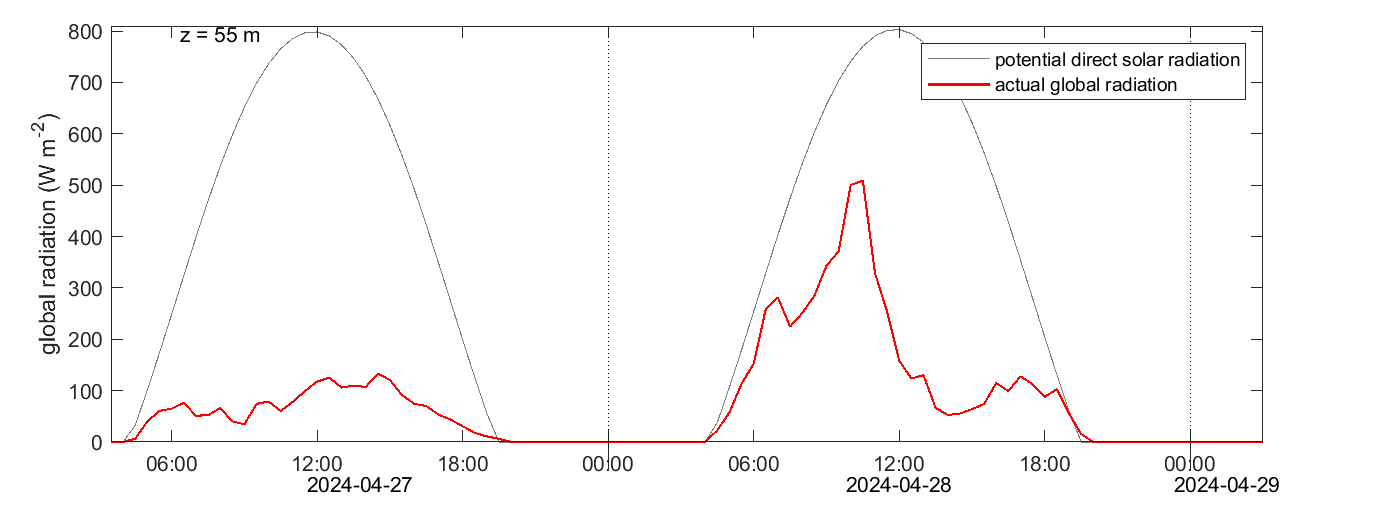
air temperature
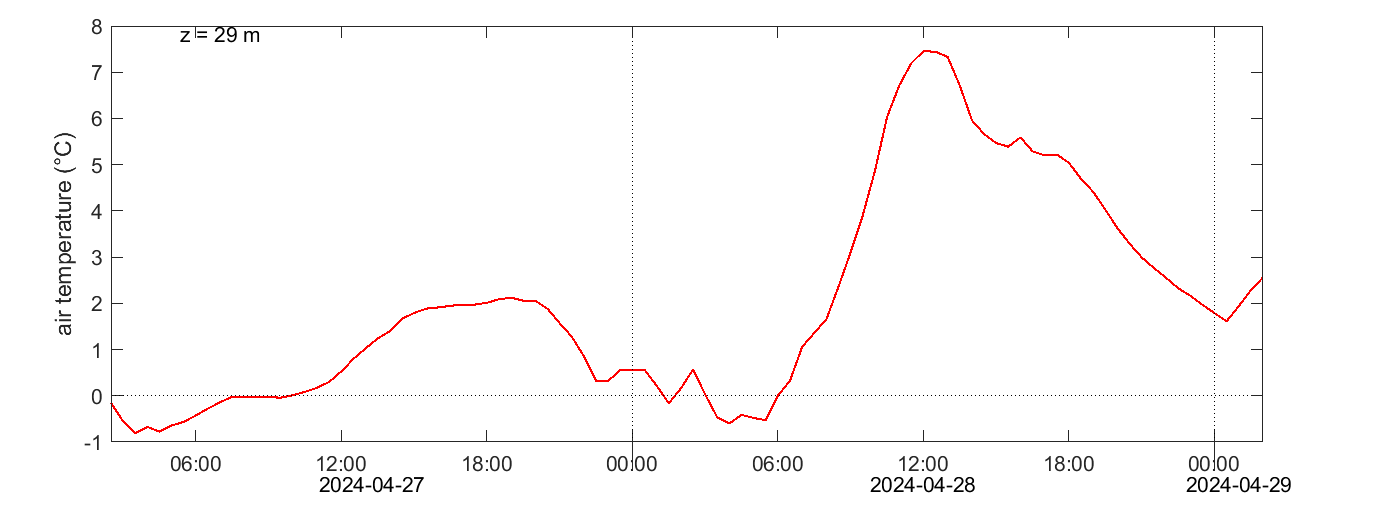
precipitation
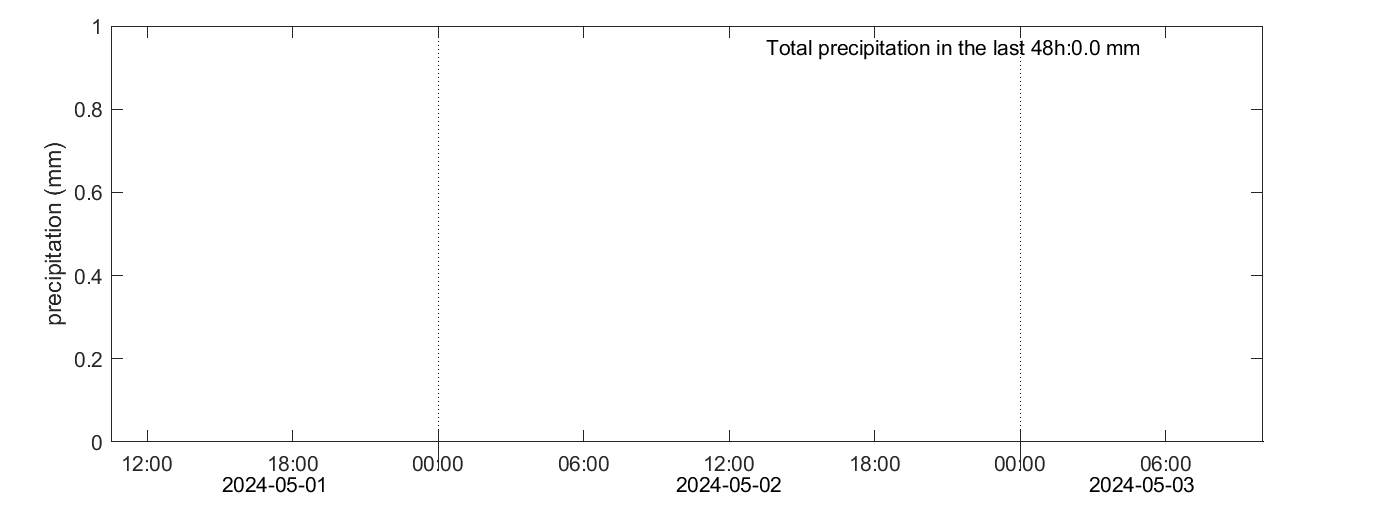
relative humidity
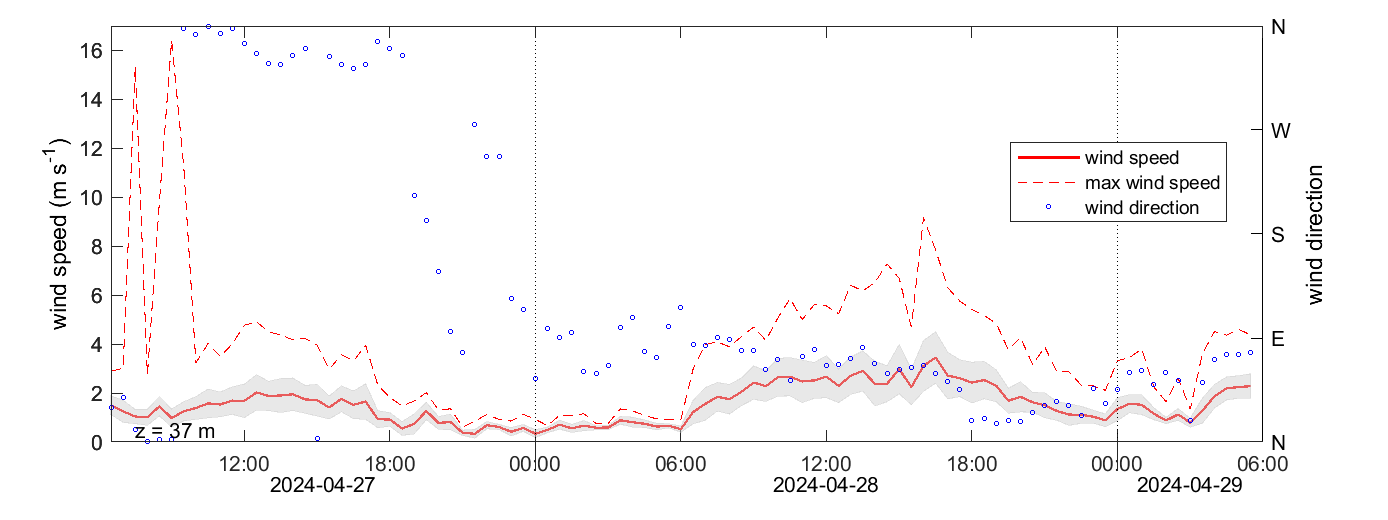
wind speed and direction
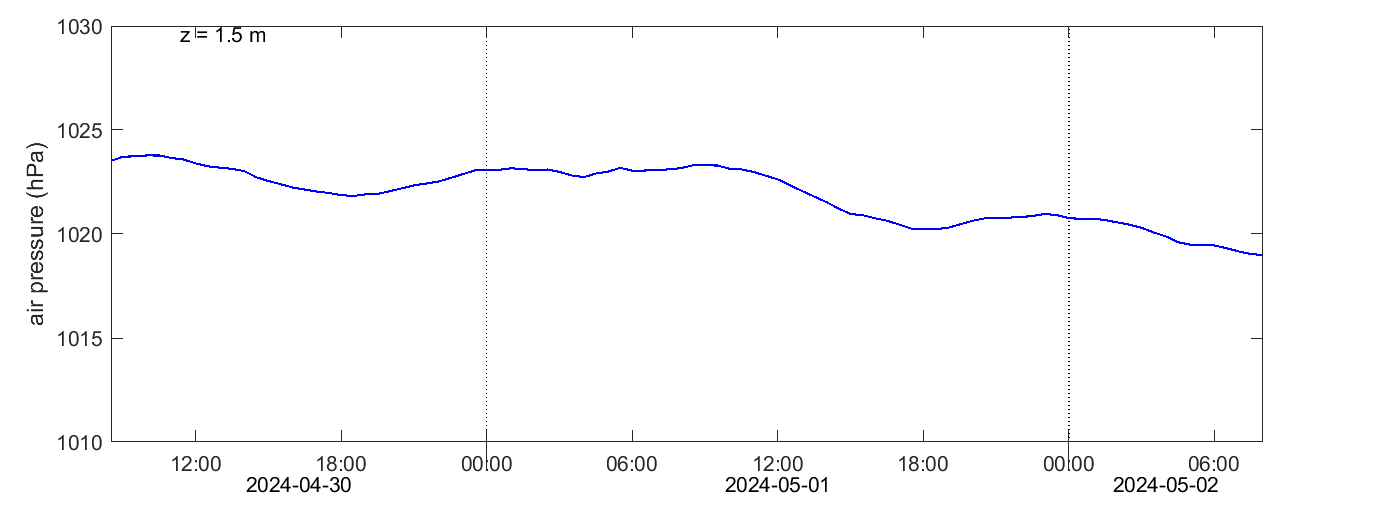
air pressure
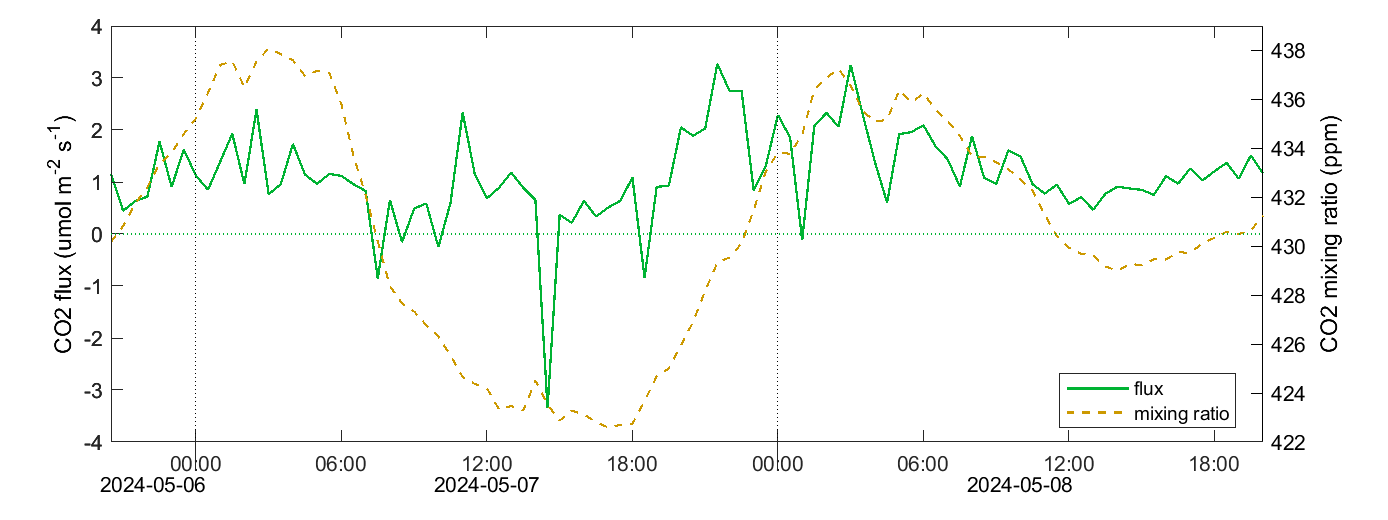
CO2 flux and mixing ratio/main mast
The eddy-covariance fluxes are raw data calculated by the Swedish National Network. Data are displayed without further quality flag filtering.
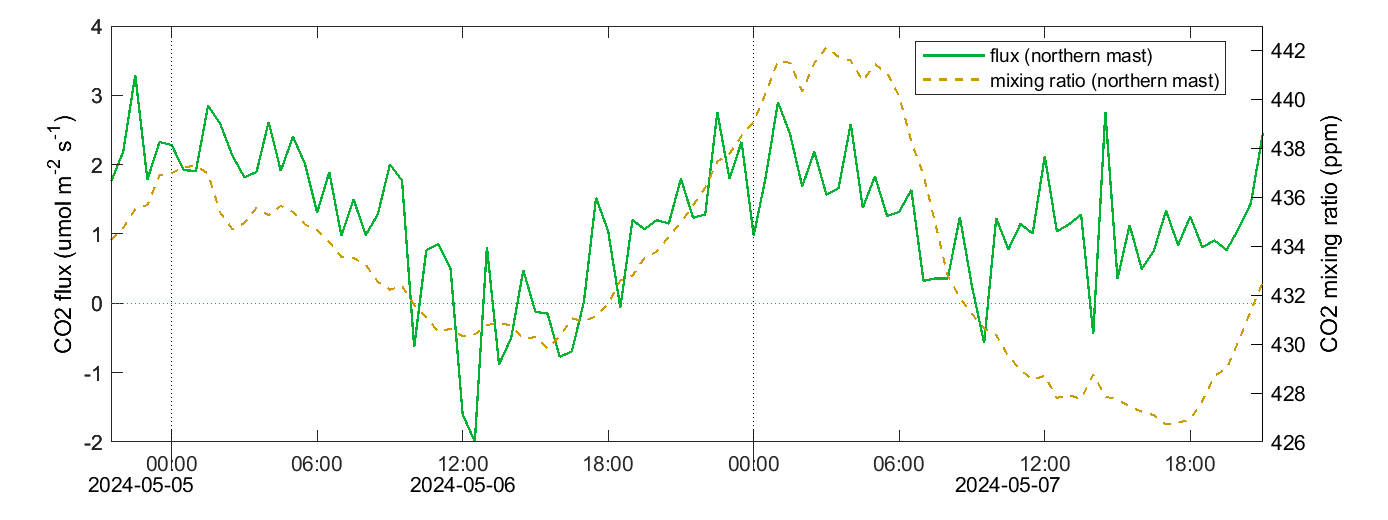
CO2 flux and mixing ratio/northern mast
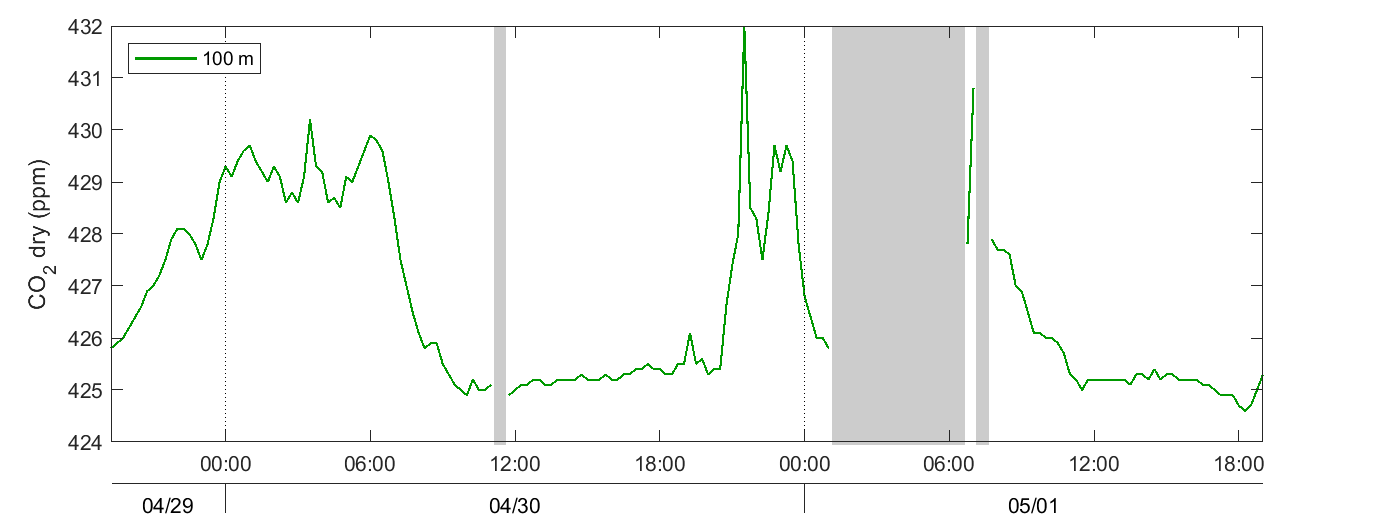
CO2 concentration
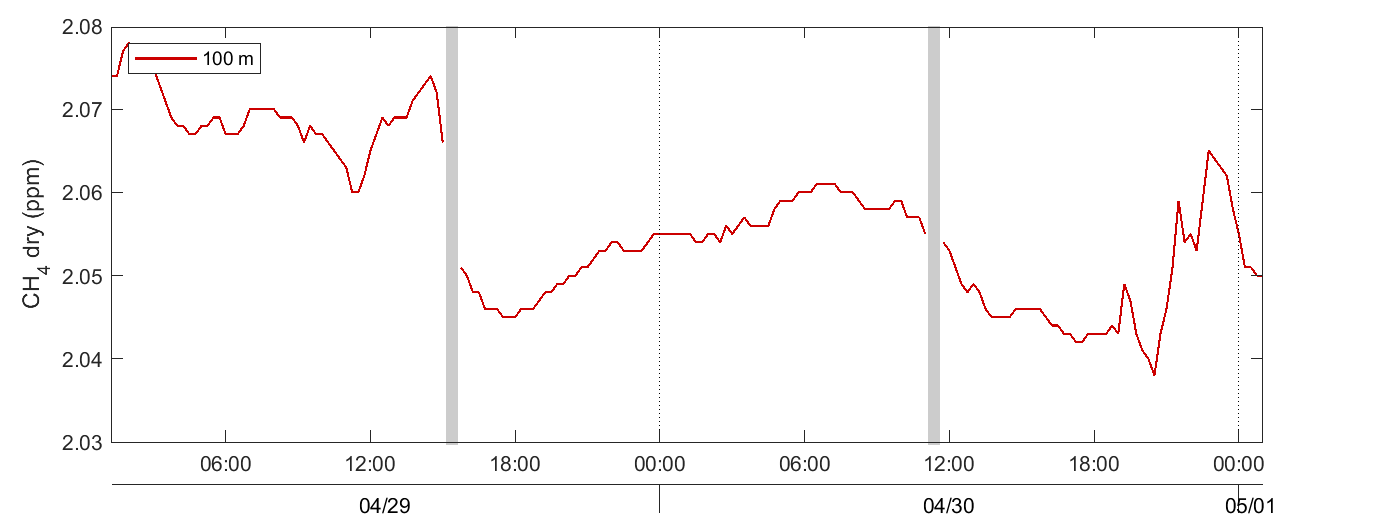
CH4 concentration
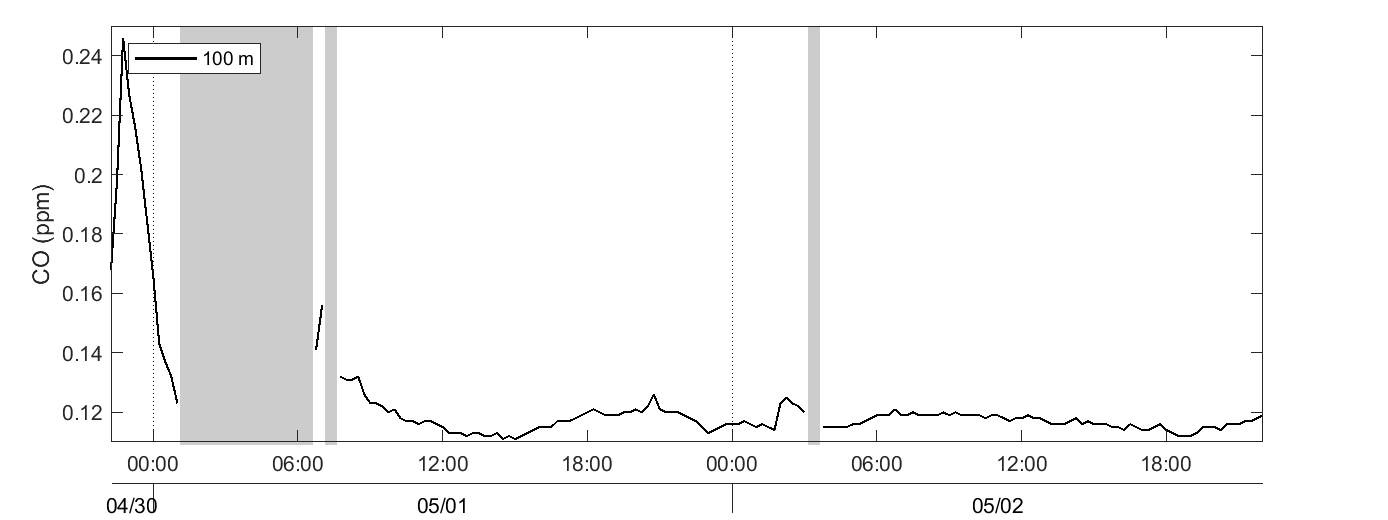
CO concentration
phenocam
Norunda – upper cam | Norunda – lower cam | |
|
|
The figures for Östergarnsholm are taken directly from the website of theDepartment of Earth Sciences, Univerity Uppsala and cover the time frame one week back; figures displayed without problems with Firefox.
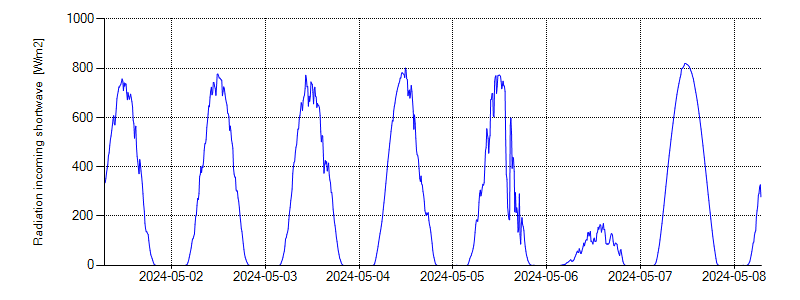
solar radiation
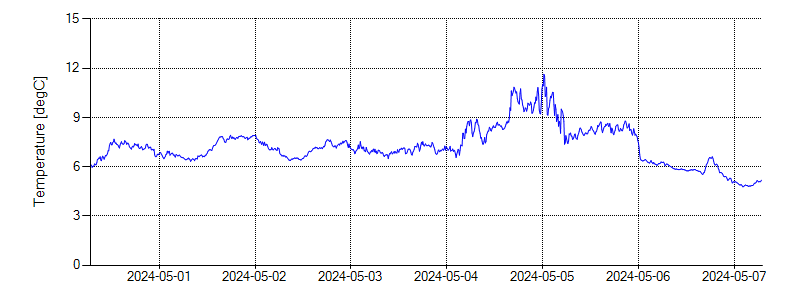
air temperature
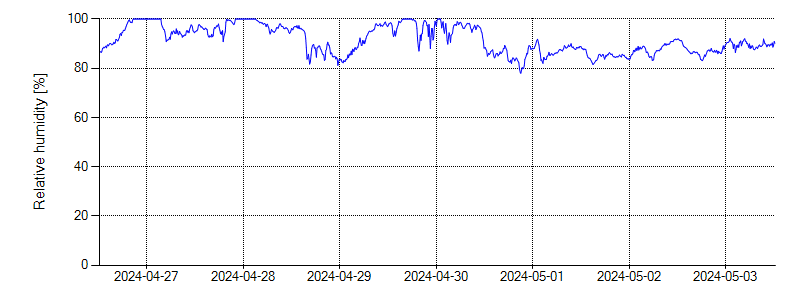
relative humidity
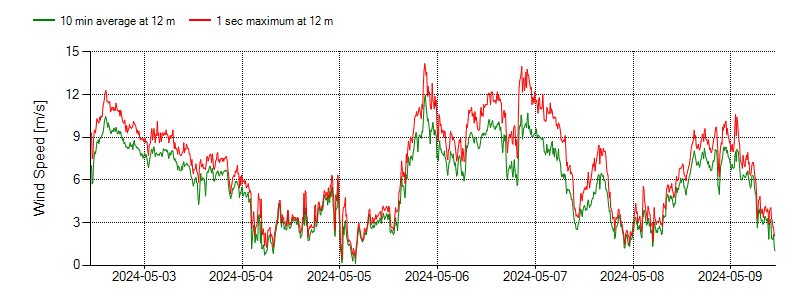
wind speed
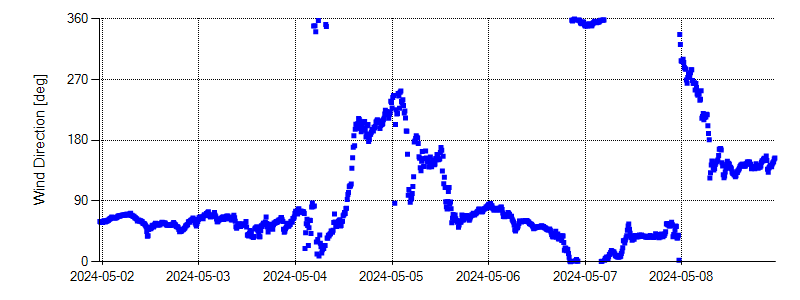
wind direction
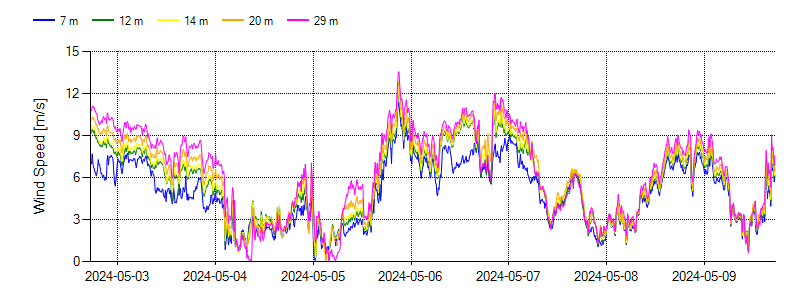
wind speed profile
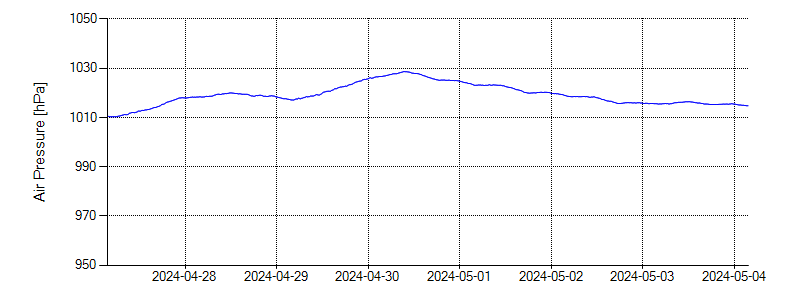
air pressure
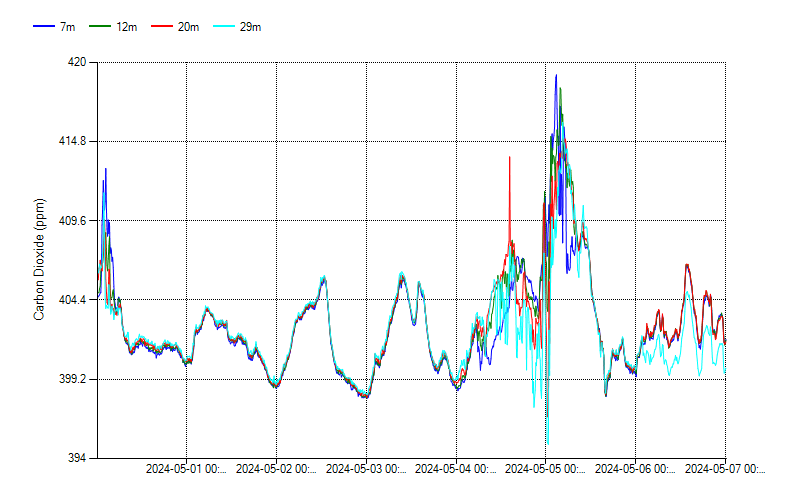
Carbon dioxide
The eddy-covariance fluxes are raw data calculated by the Swedish National Network. Data are displayed without further quality flag filtering.
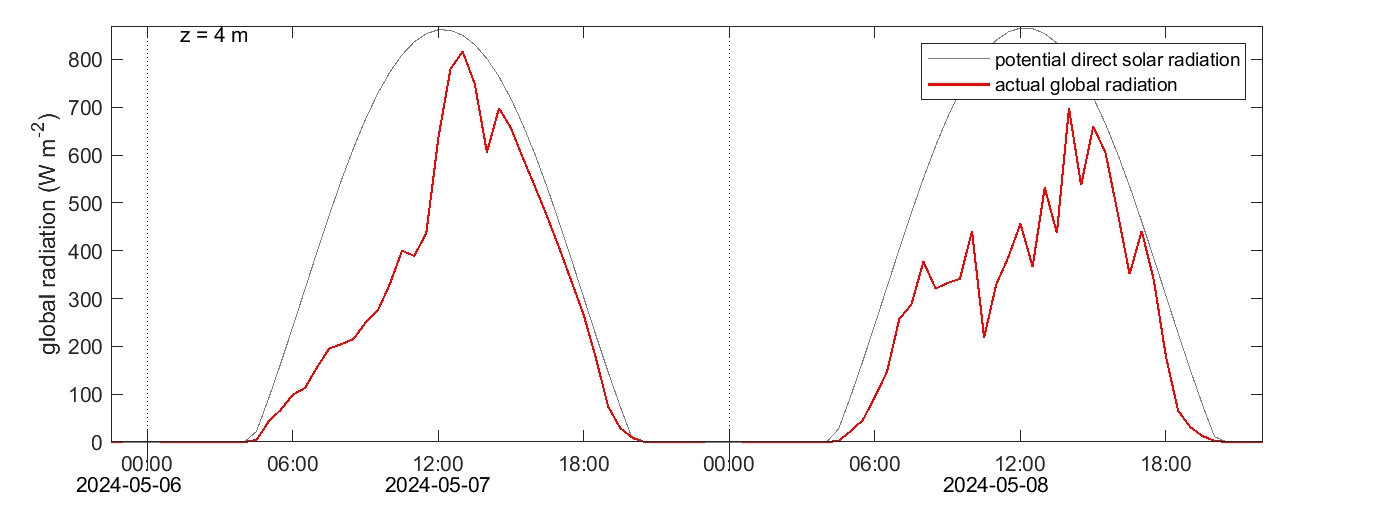
solar radiation
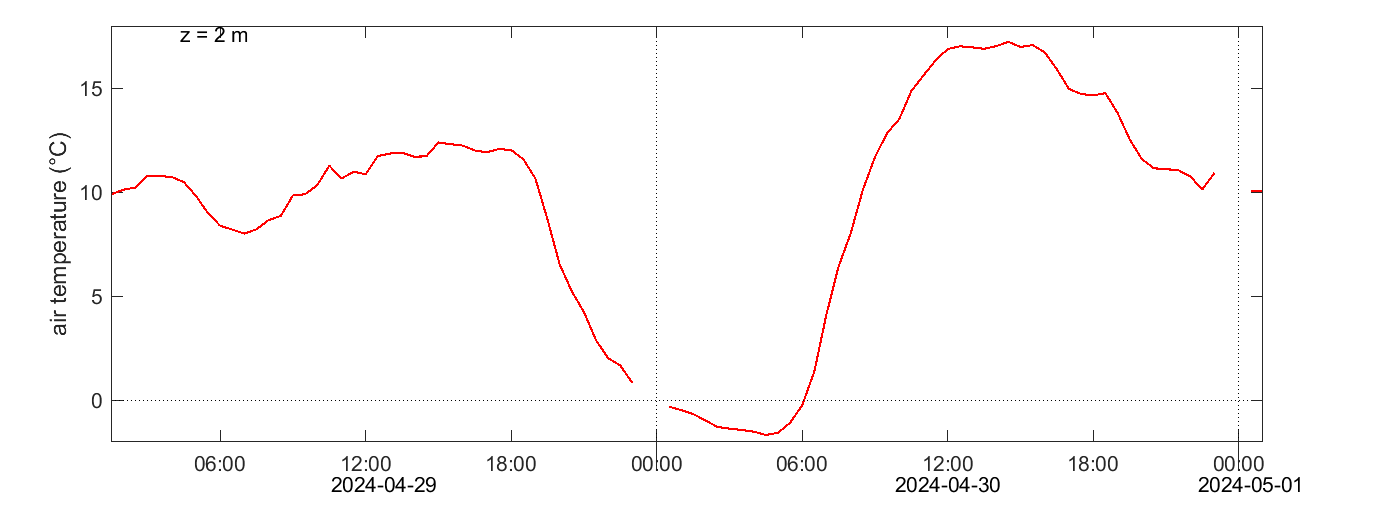
air temperature
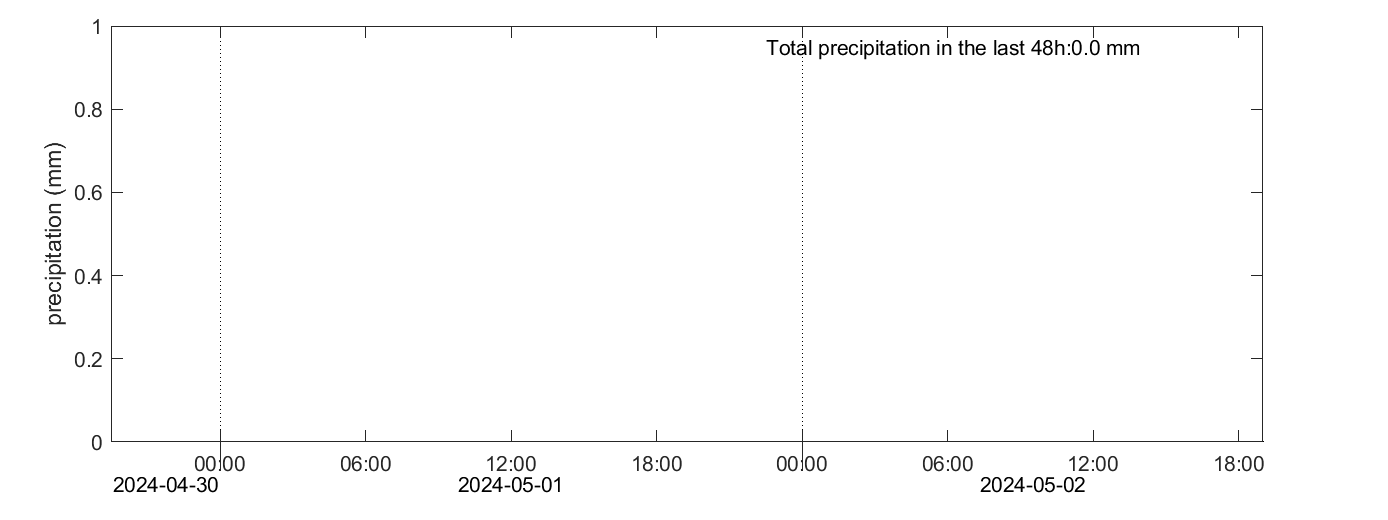
precipitation
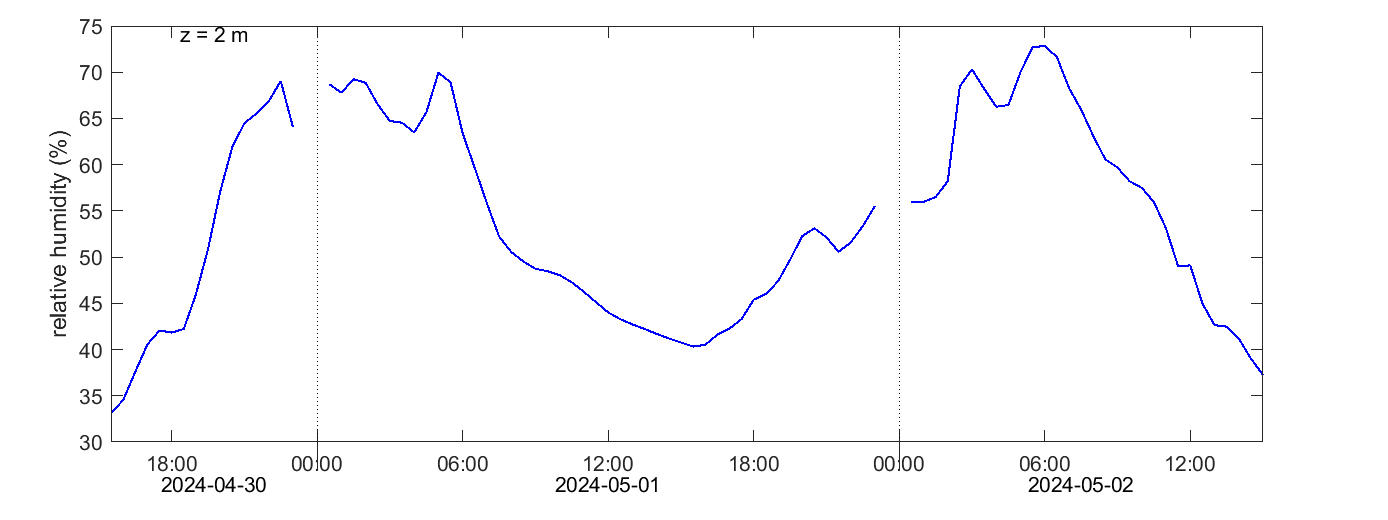
relative humidity
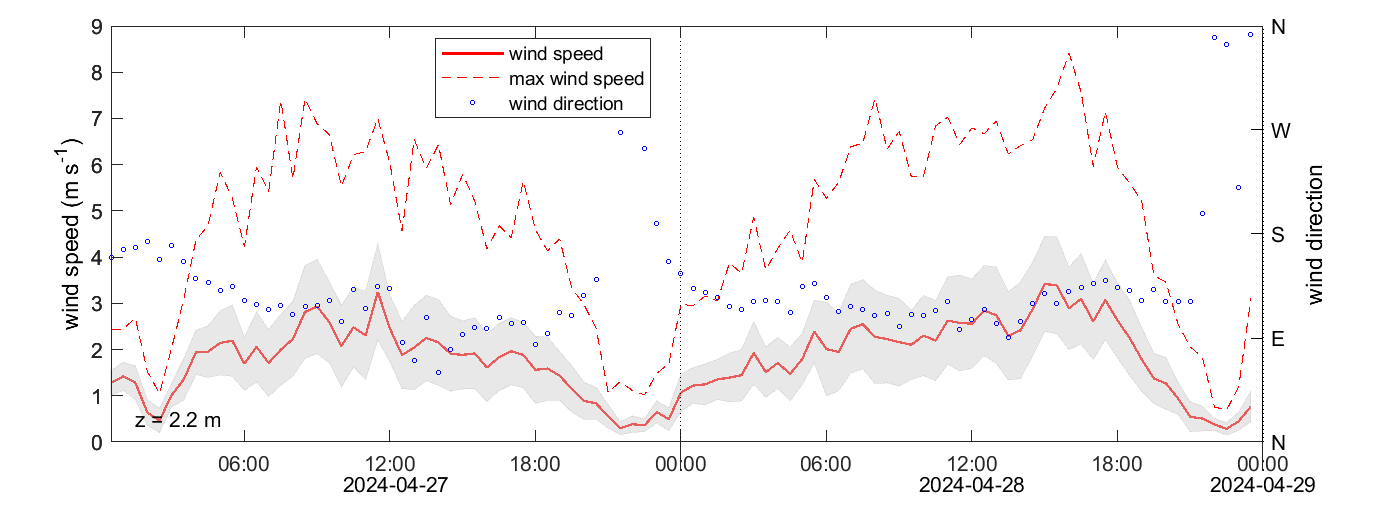
wind speed and direction
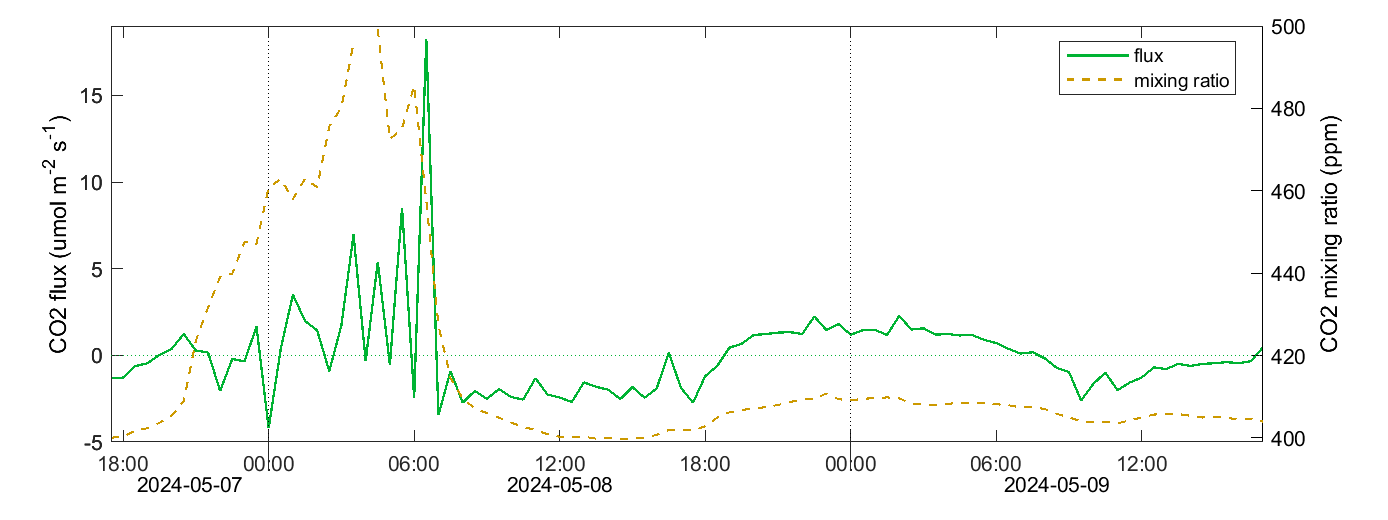
CO2 flux and mixing ratio (LI-COR)
The eddy-covariance fluxes are raw data calculated by the Swedish National Network. Data are displayed without further quality flag filtering.
CO2 flux and mixing ratio
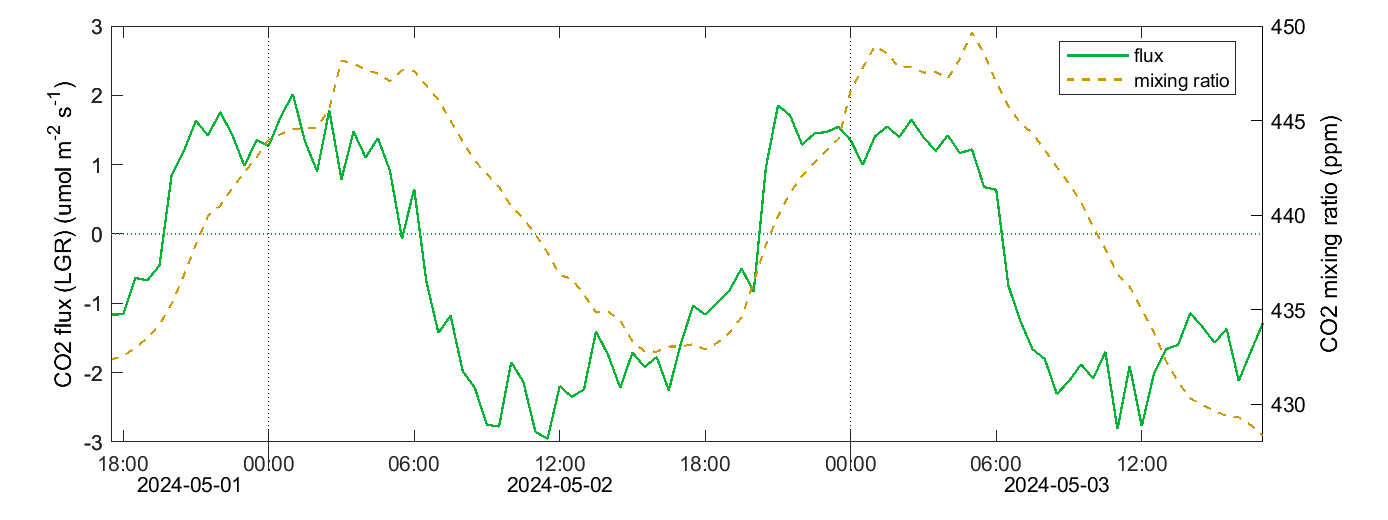
CO2 flux and mixing ratio (LGR)
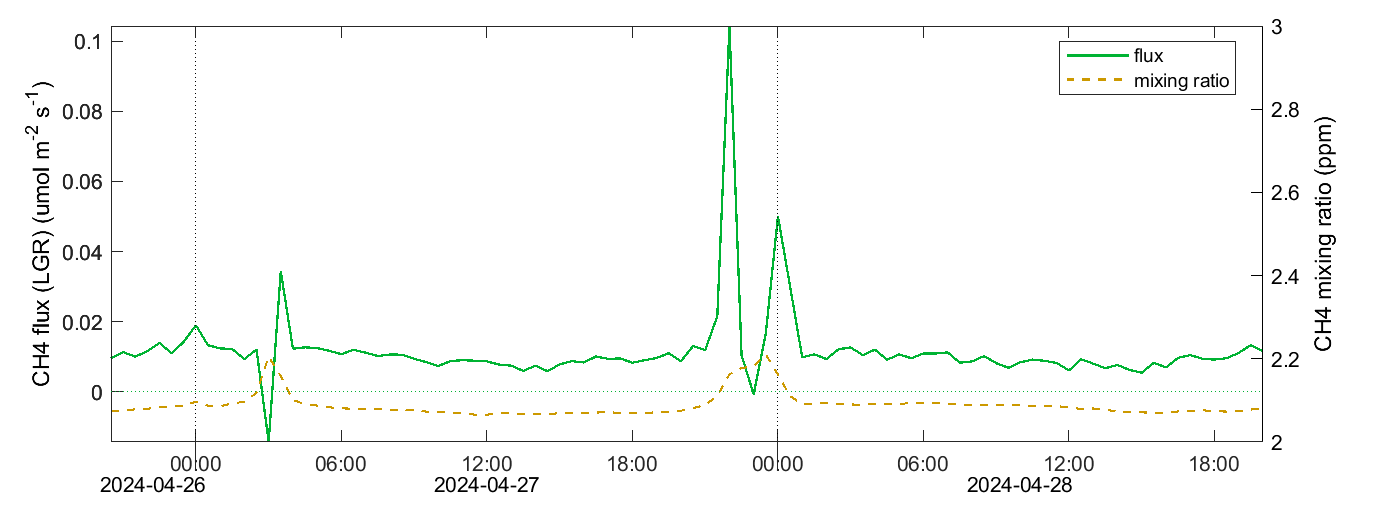
The eddy-covariance fluxes are raw data calculated by the Swedish National Network. Data are displayed without further quality flag filtering.
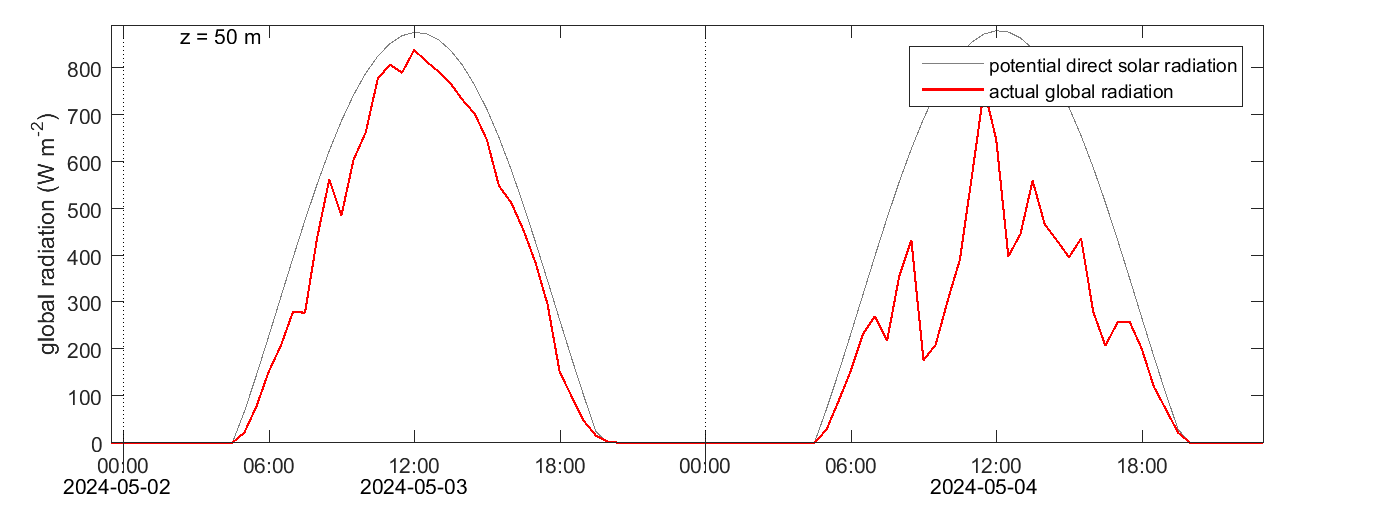
solar radiation
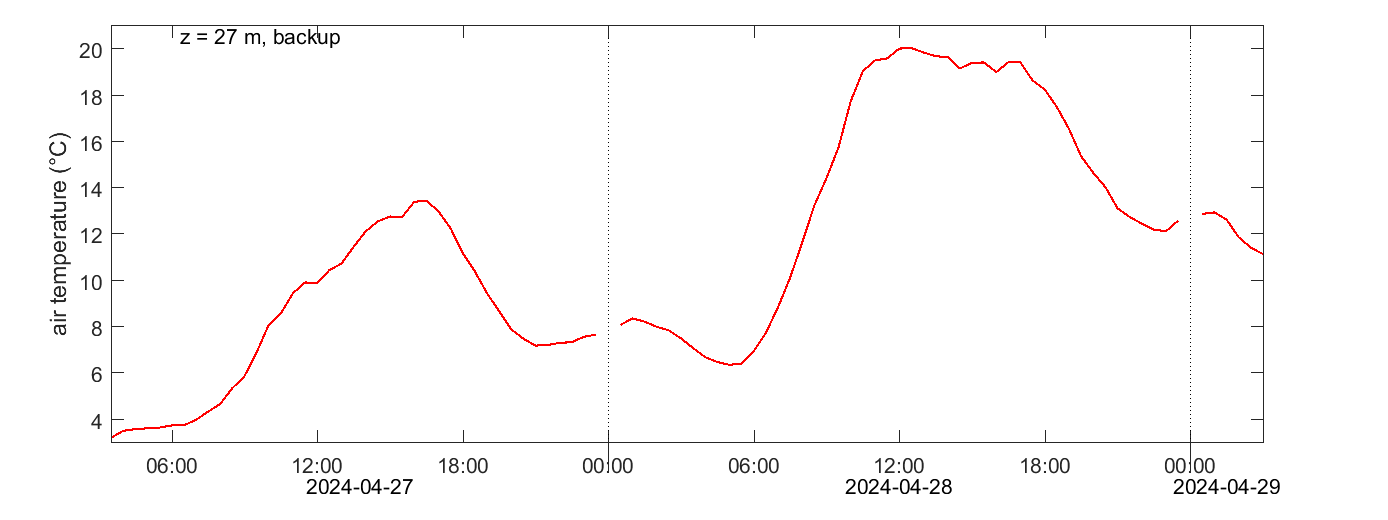
air temperature
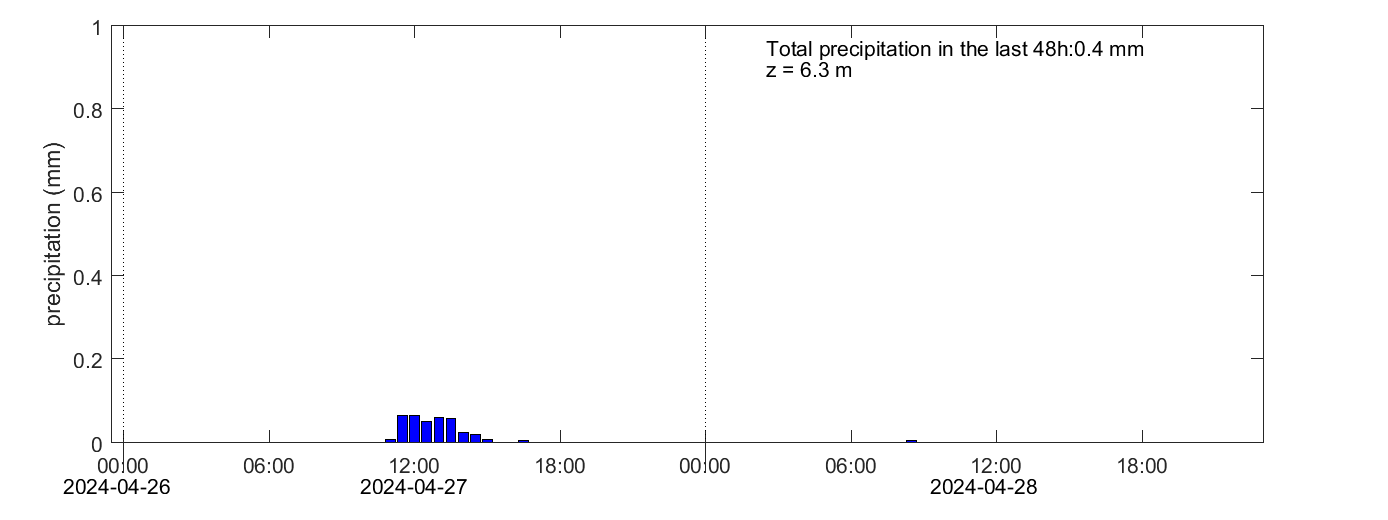
precipitation
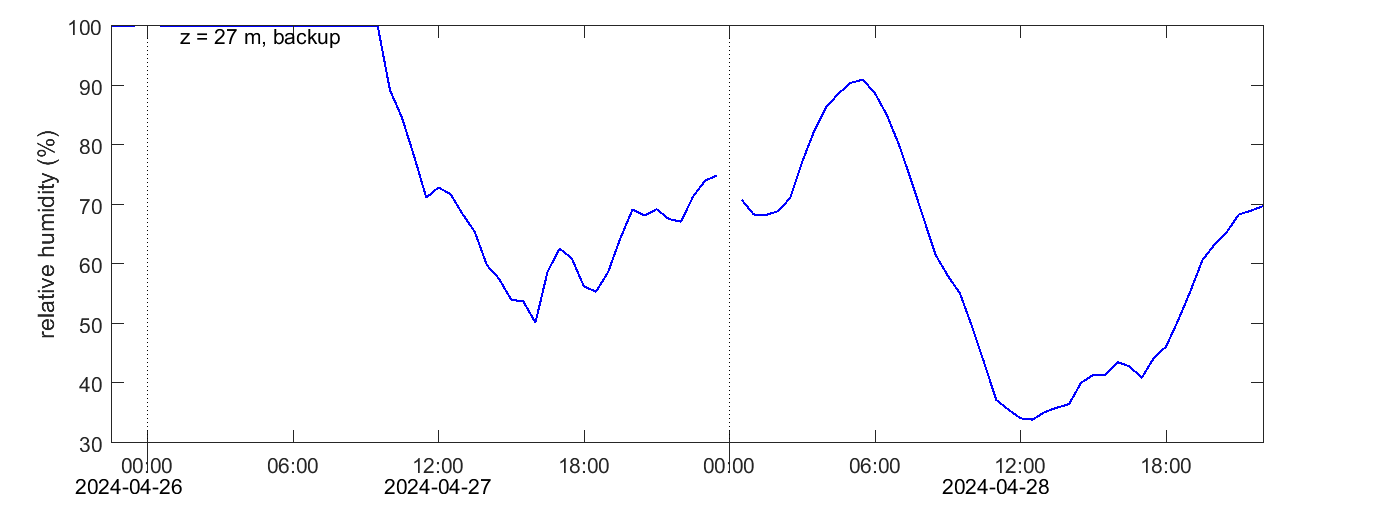
relative humidity
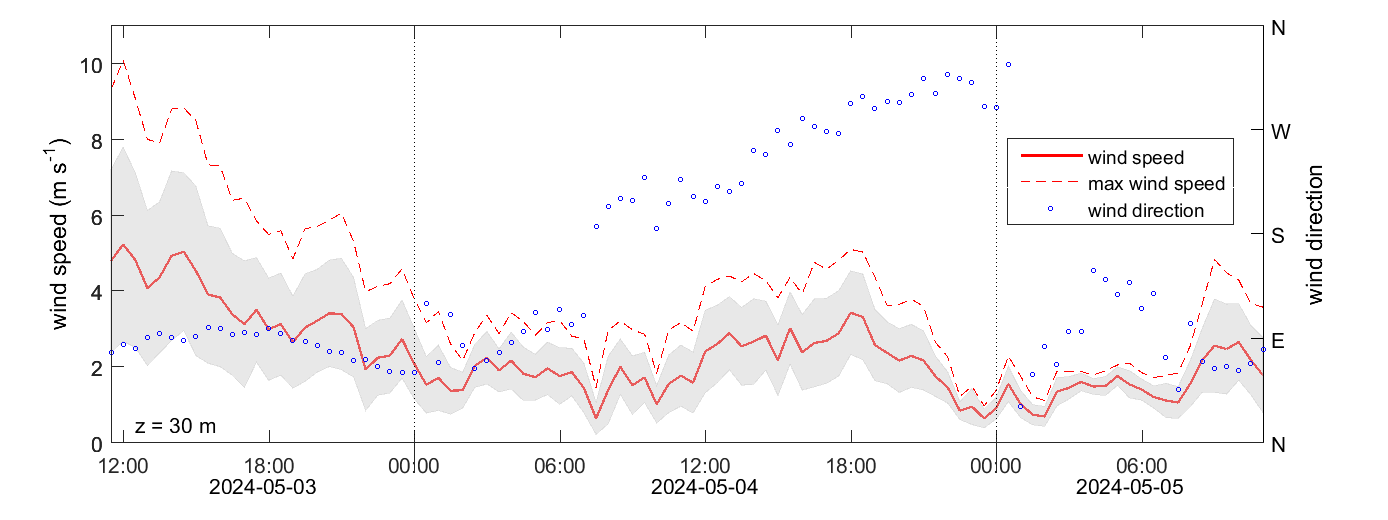
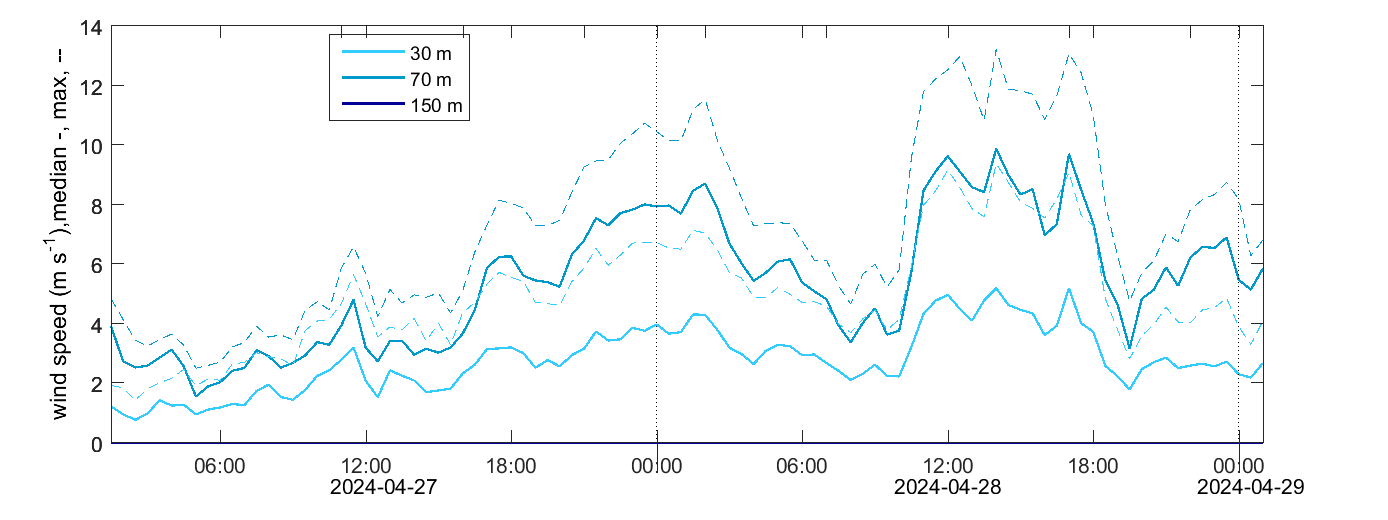
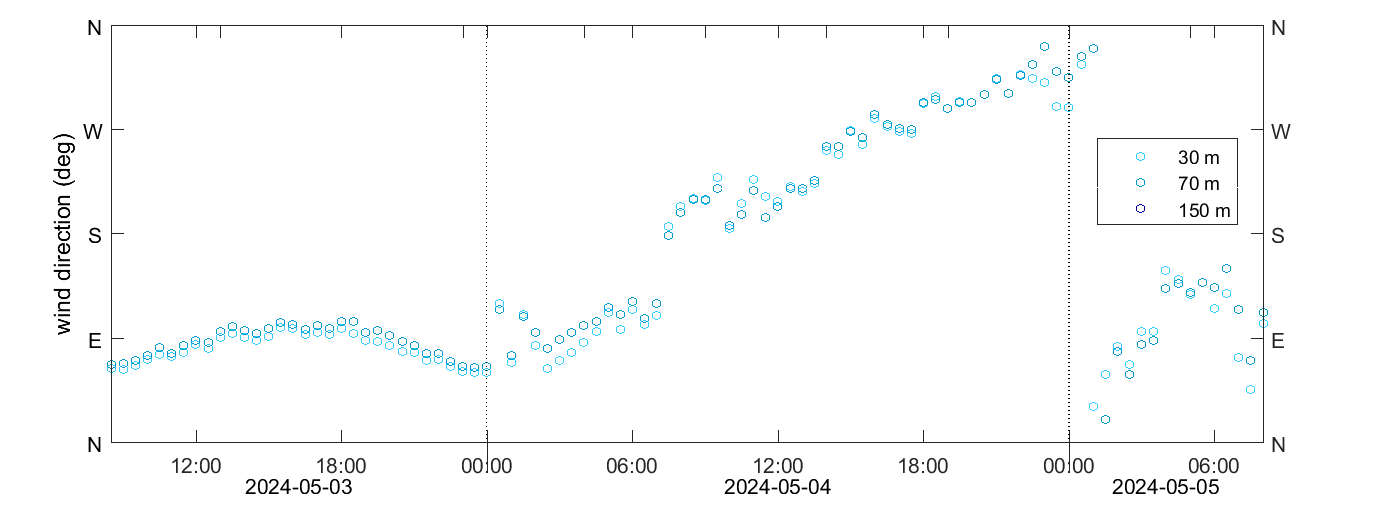
wind speed and direction
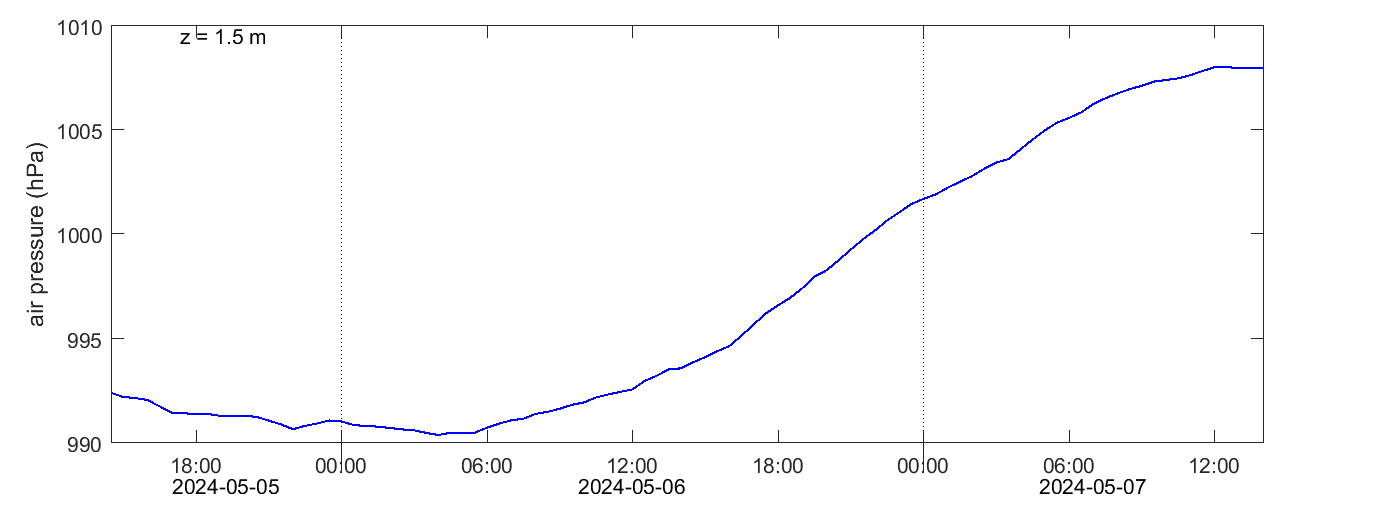
air pressure
CO2 flux and mixing ratio
The eddy-covariance fluxes are raw data calculated by the Swedish National Network. Data are displayed without further quality flag filtering.
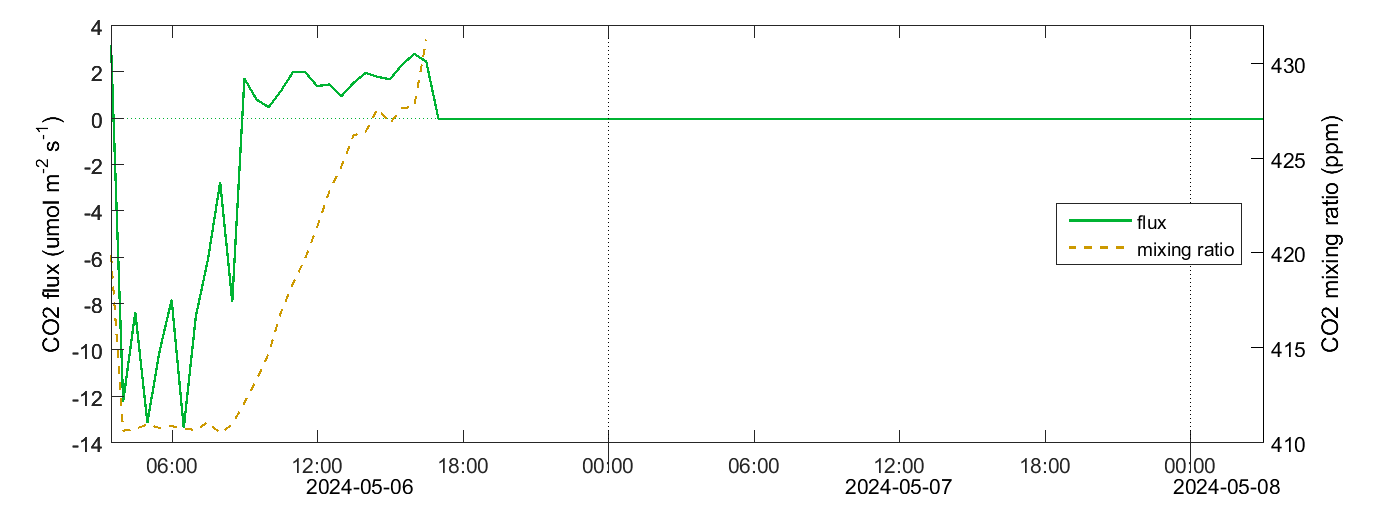
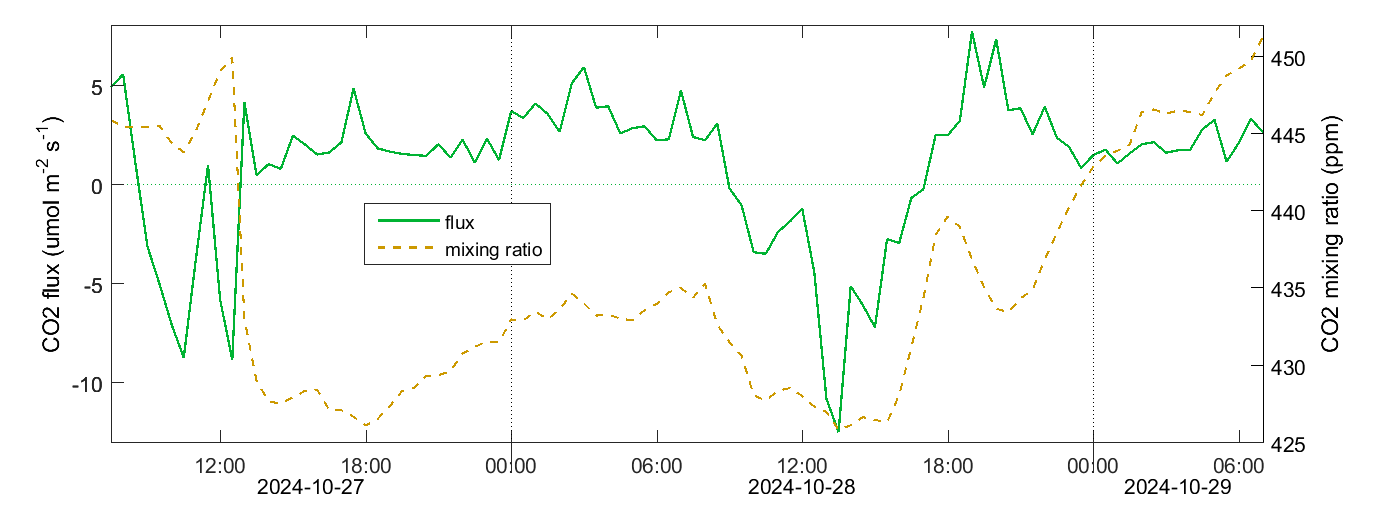
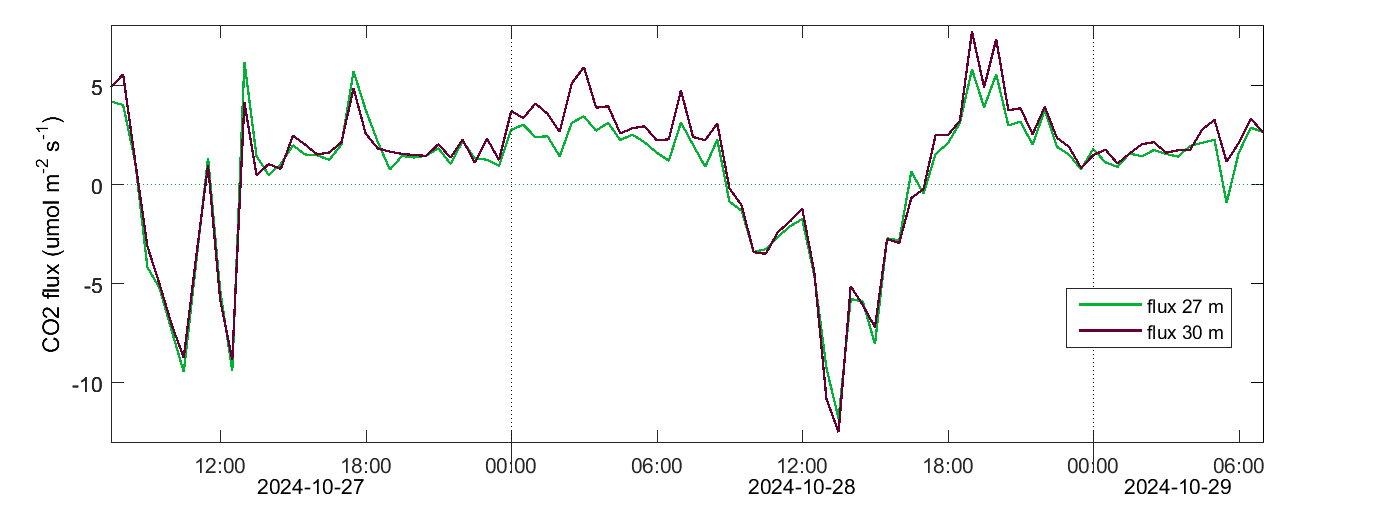
CO2 concentration
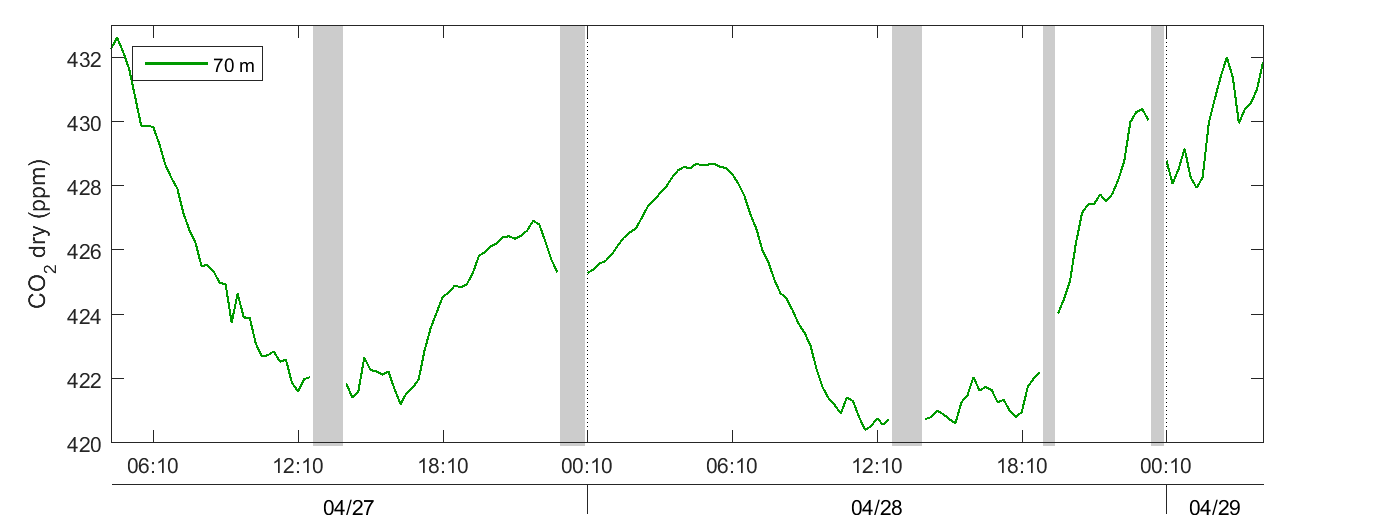
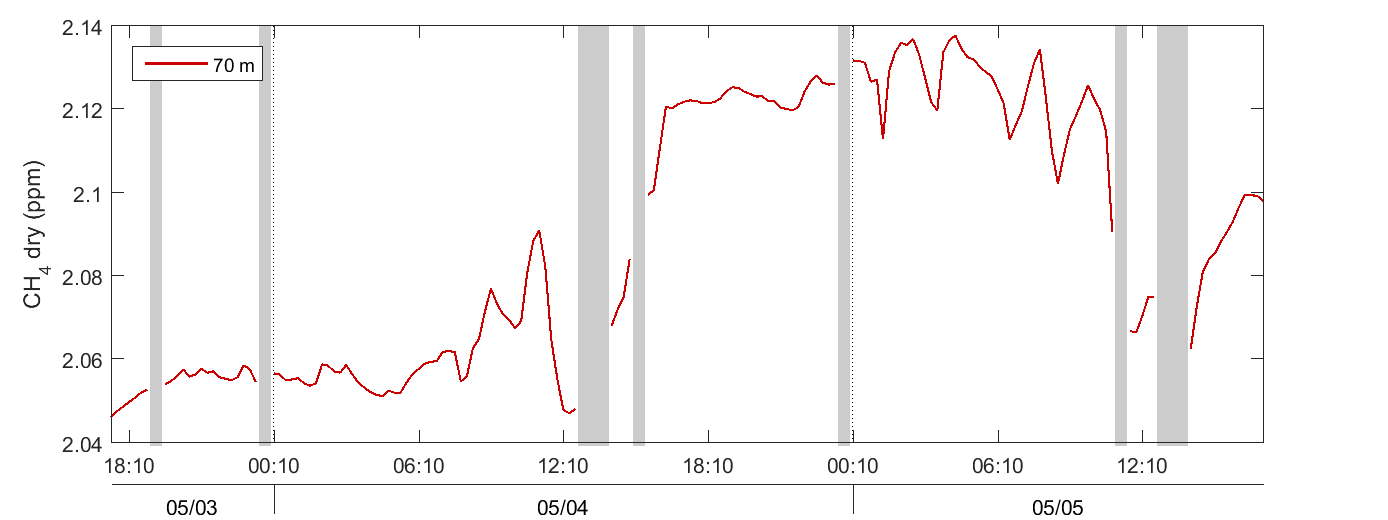
CH4 concentration
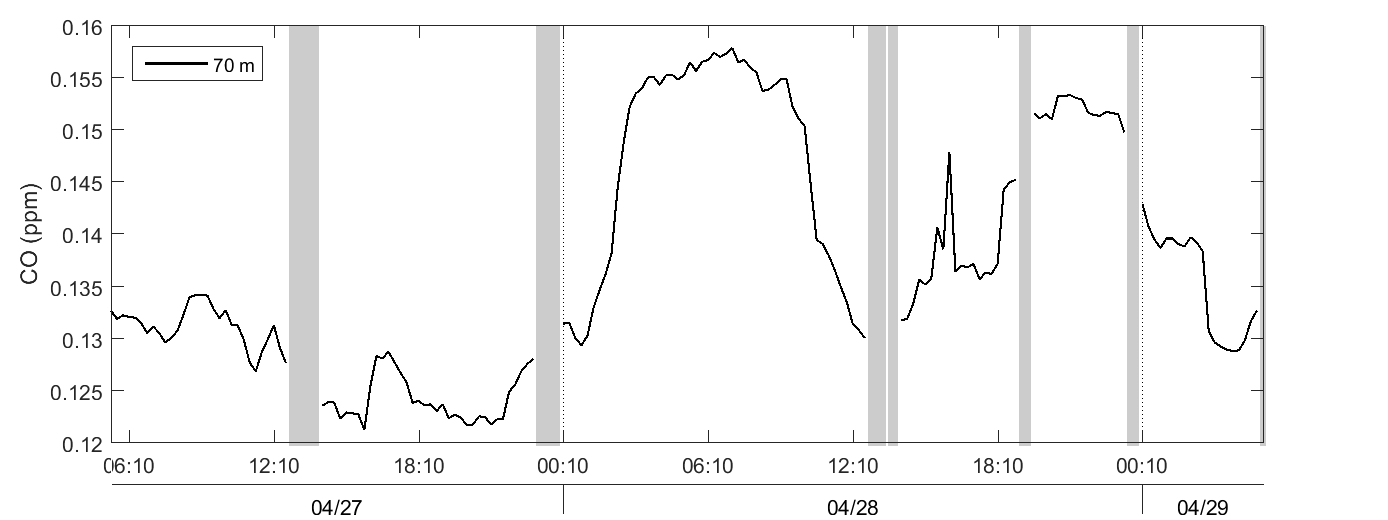
CO concentration
phenocam
Hyltemossa – Above canopy | Hyltemossa – Below canopy | |
|
|
The eddy-covariance fluxes are raw data calculated by the Swedish National Network. Data are displayed without further quality flag filtering.
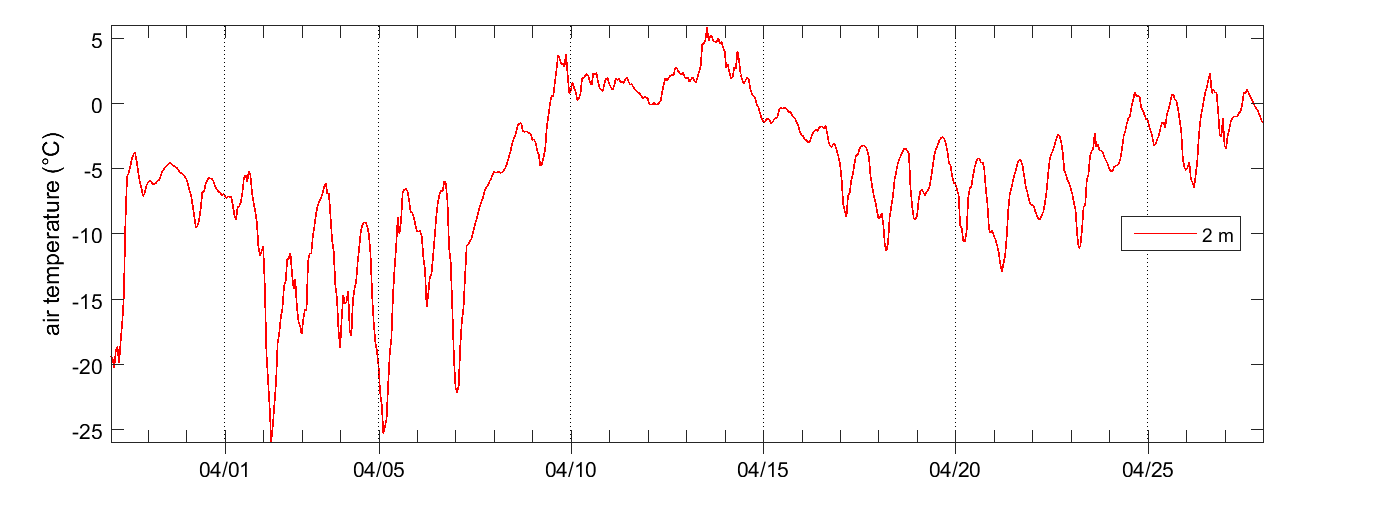
solar radiation
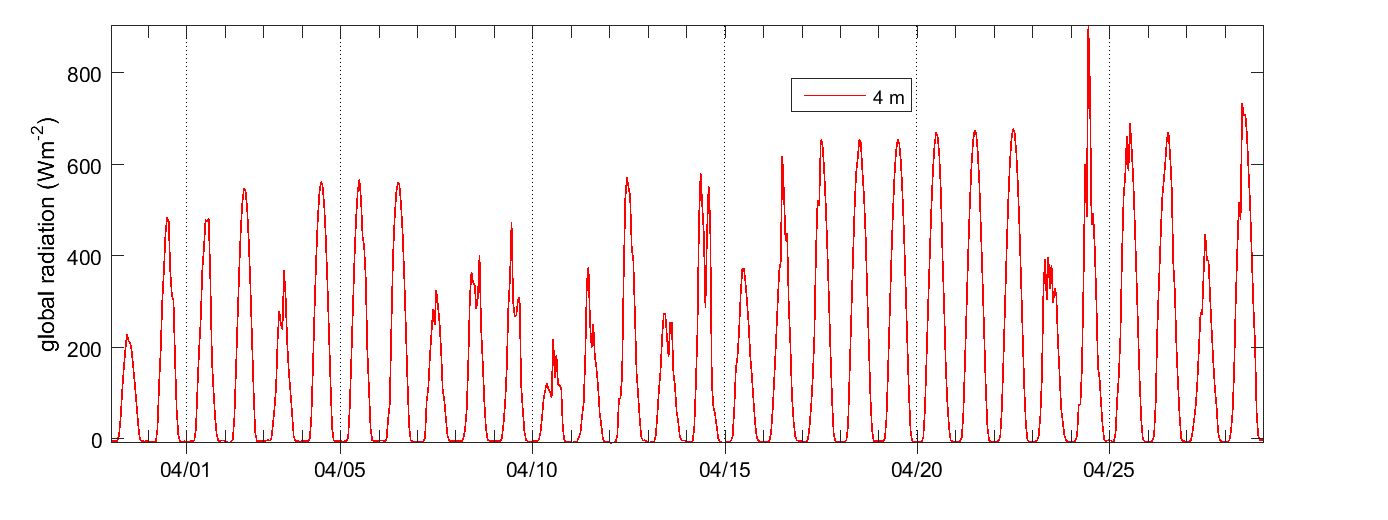
air temperature
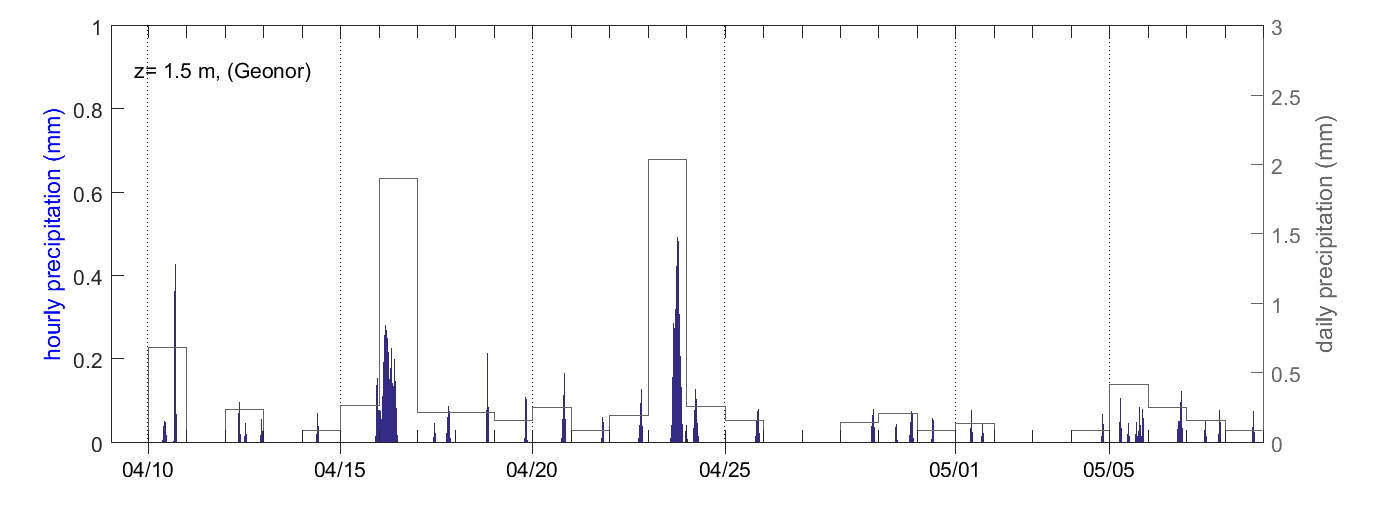
precipitation
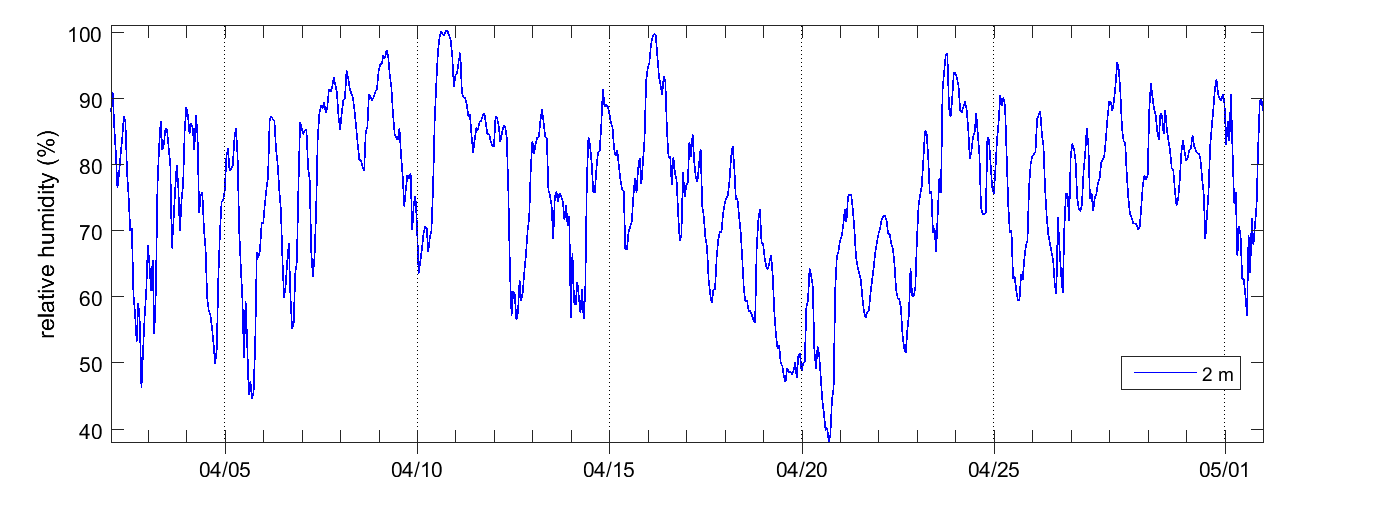
relative humidity
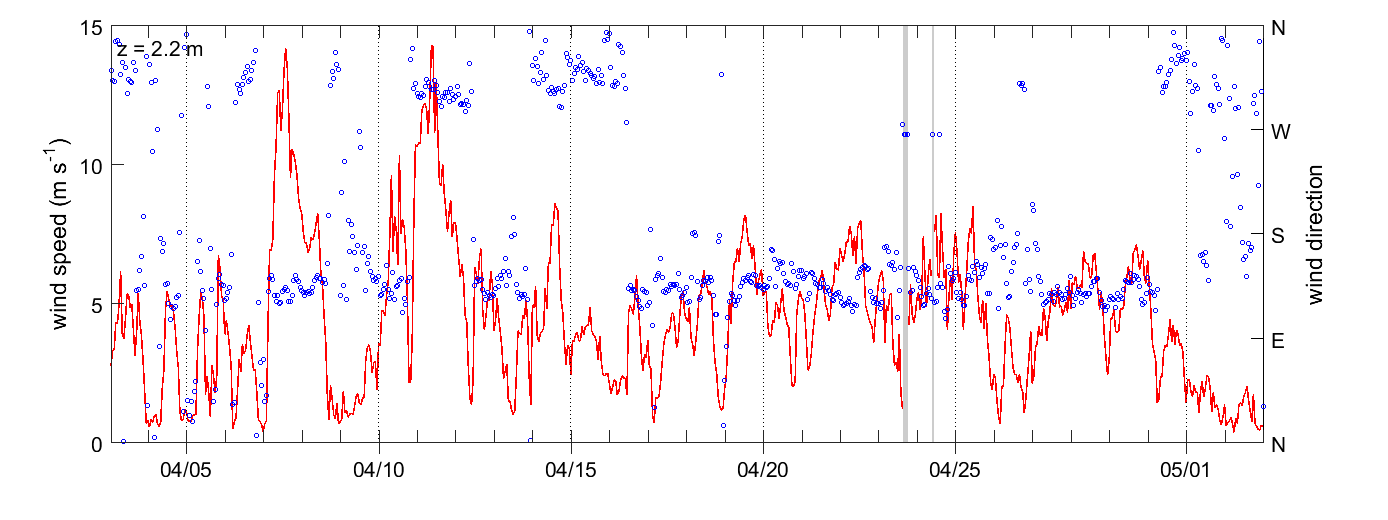
wind speed and direction
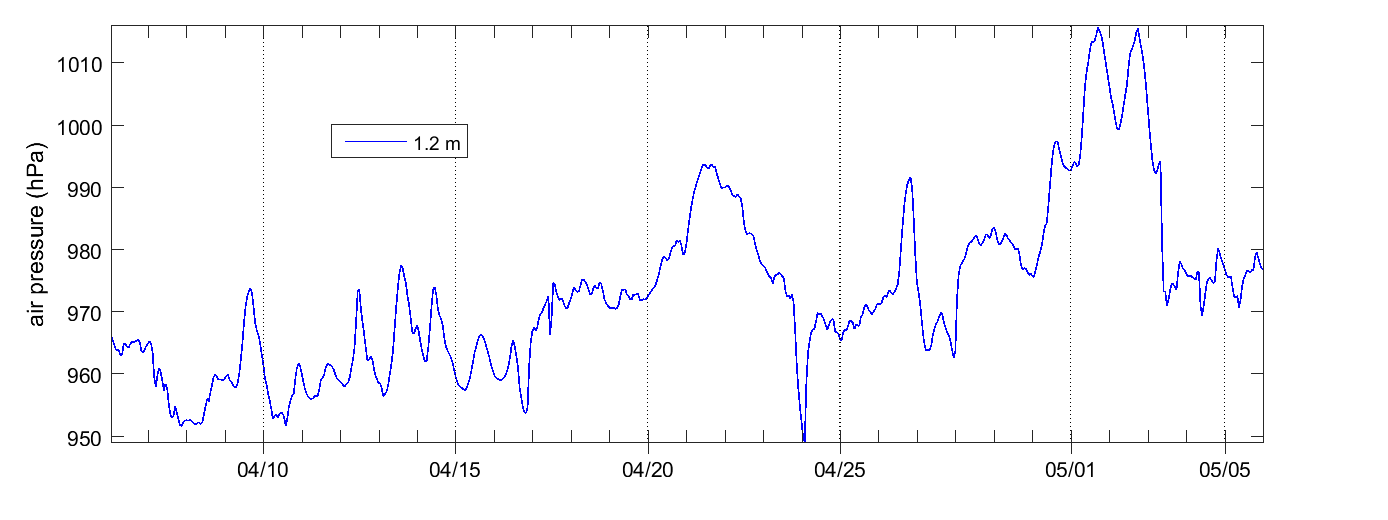
air pressure
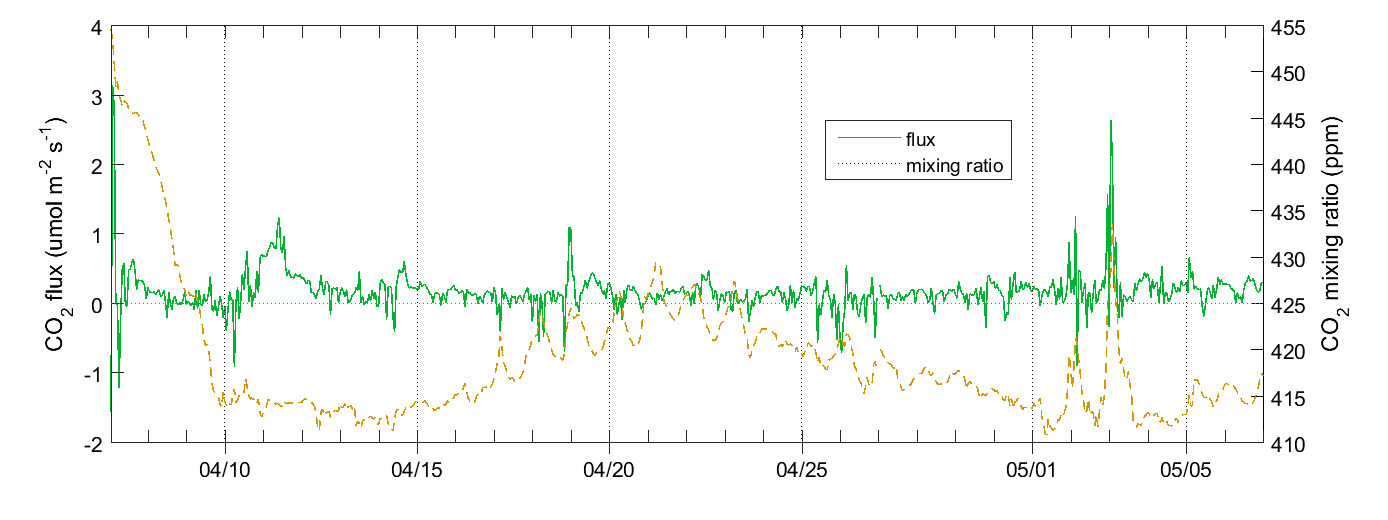
CO2 flux and mixing ratio (LI-COR)
The eddy-covariance fluxes are raw data calculated by the Swedish National Network. Data are displayed without further quality flag filtering.
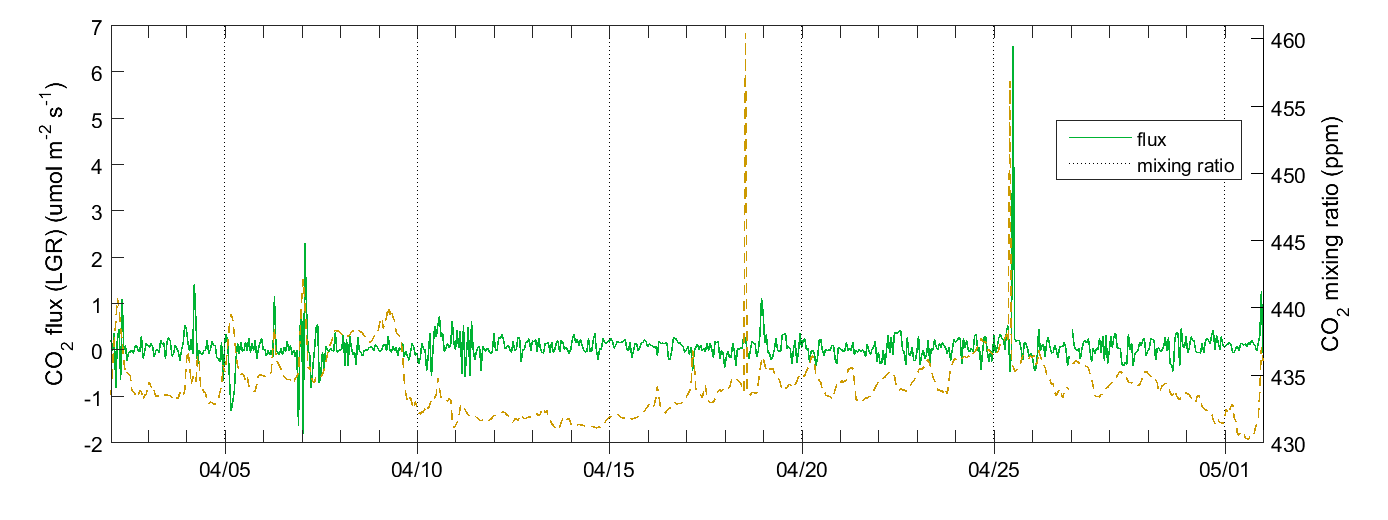
CO2 flux and mixing ratio (LGR)
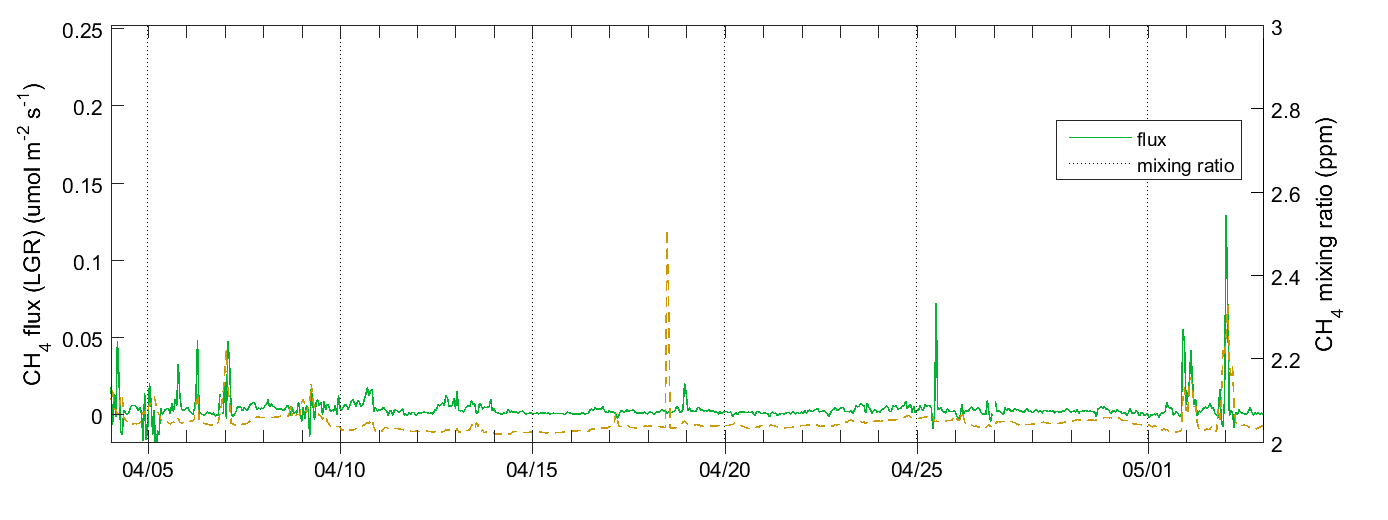
CH4 flux and mixing ratio (LGR)
phenocam
Abisko-Stordalen | ||
|
The eddy-covariance fluxes are raw data calculated by the Swedish National Network. Data are displayed without further quality flag filtering.
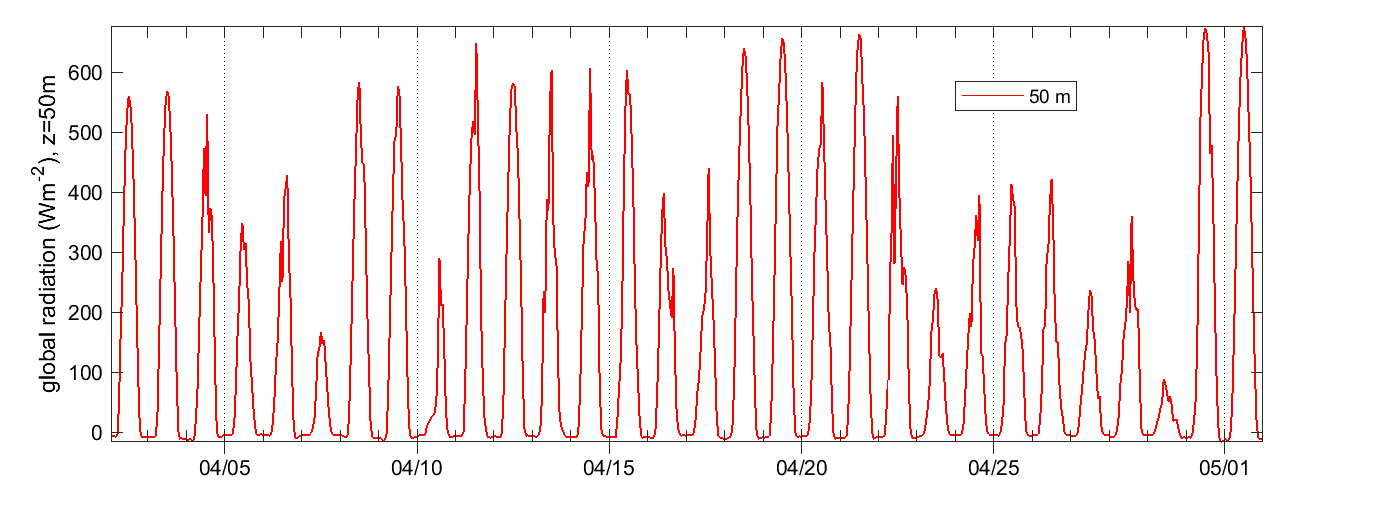
solar radiation
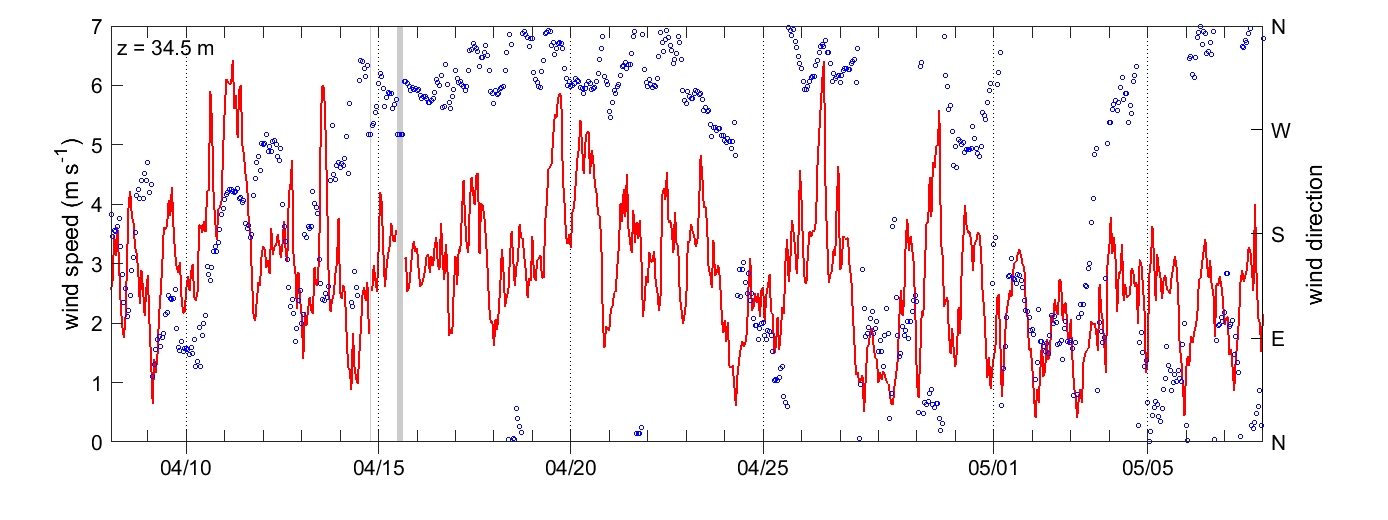
air temperature
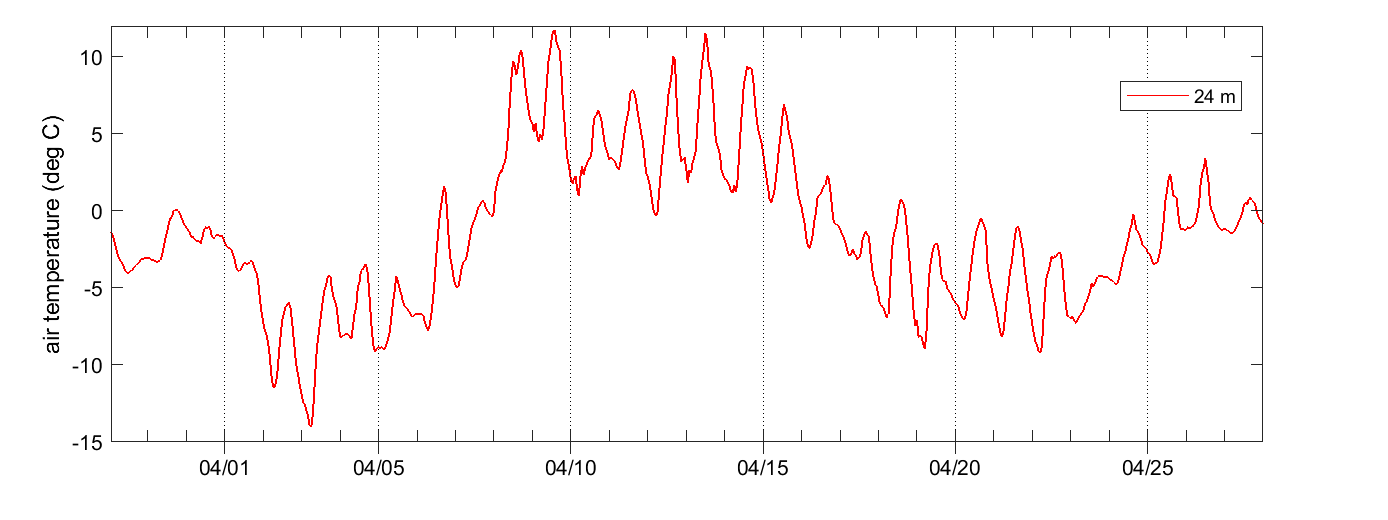
precipitation
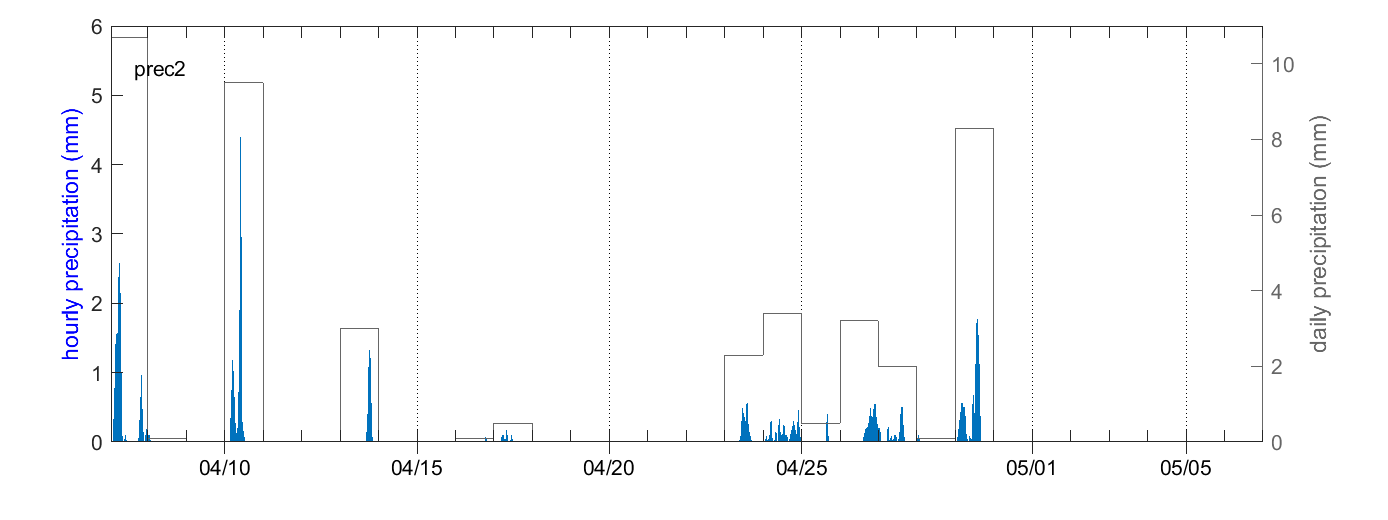
relative humidity
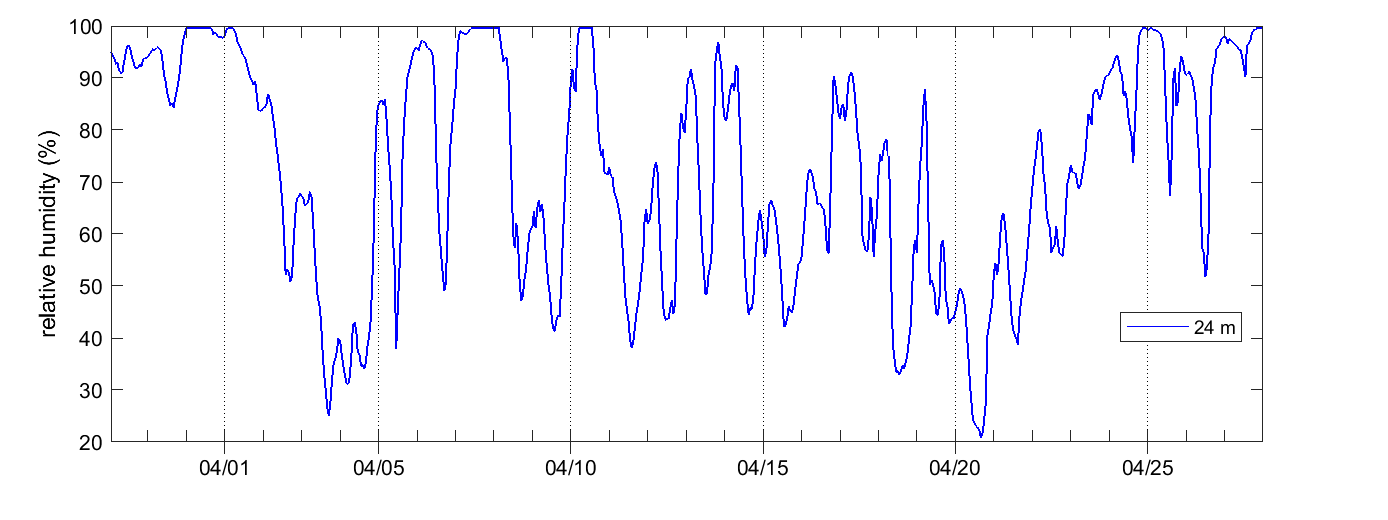
wind speed and direction
air pressure
CO2 flux and mixing ratio
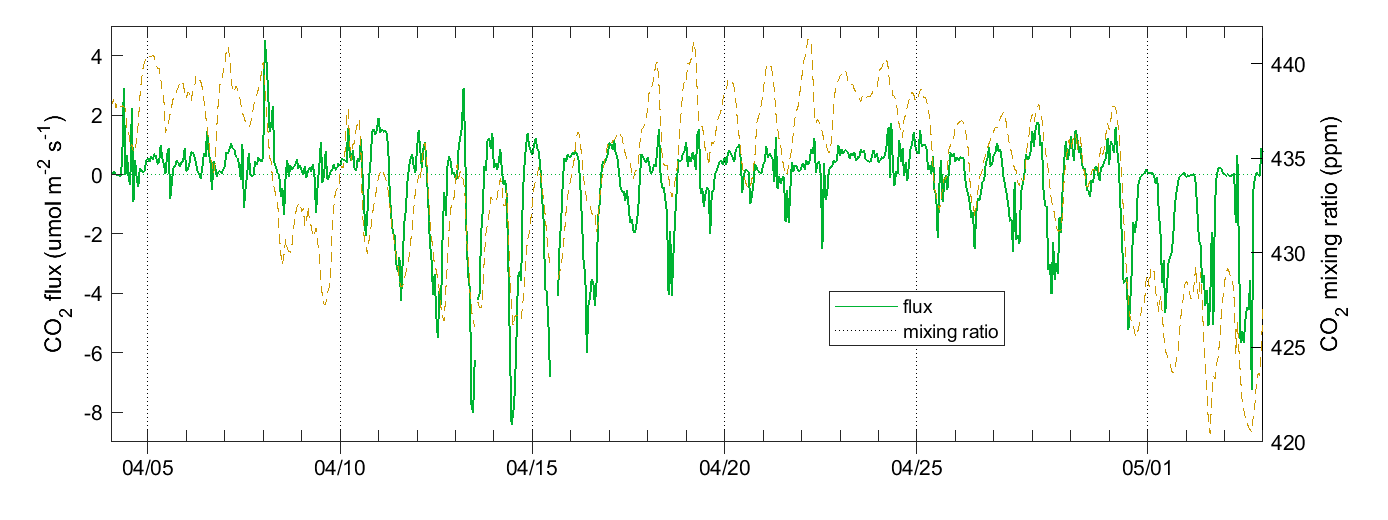
The eddy-covariance fluxes are raw data calculated by the Swedish National Network. Data are displayed without further quality flag filtering.
CO2 concentration
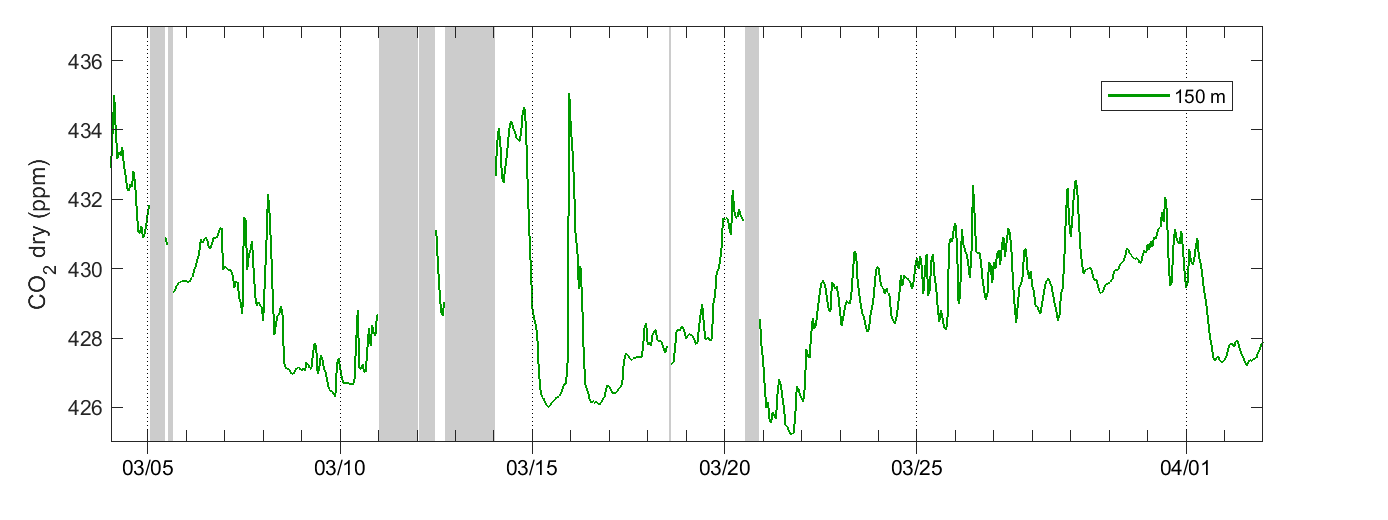
CH4 concentration
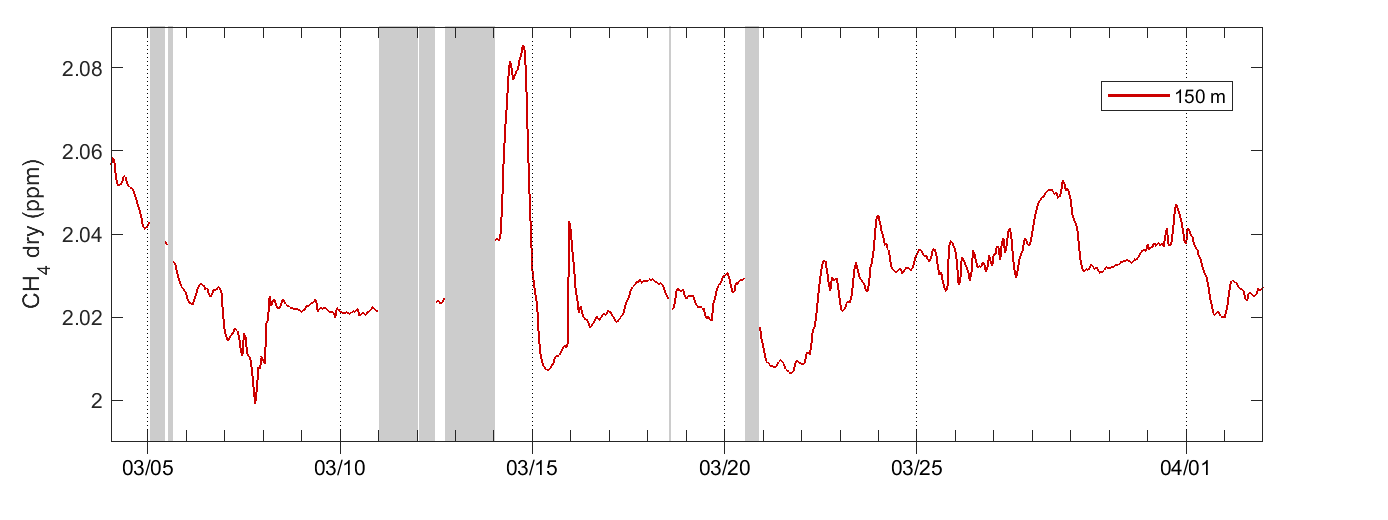
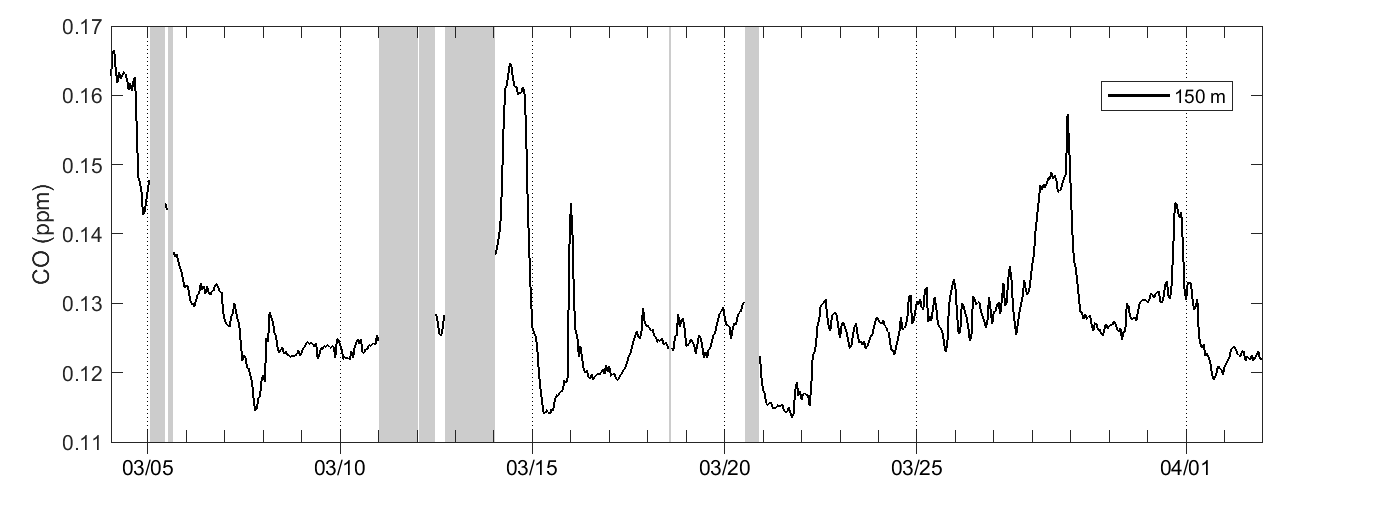
CO concentration
phenocam
Svartberget – Above canopy | Svartberget – Below canopy | |
|
|
The eddy-covariance fluxes are raw data calculated by the Swedish National Network. Data are displayed without further quality flag filtering.
solar radiation
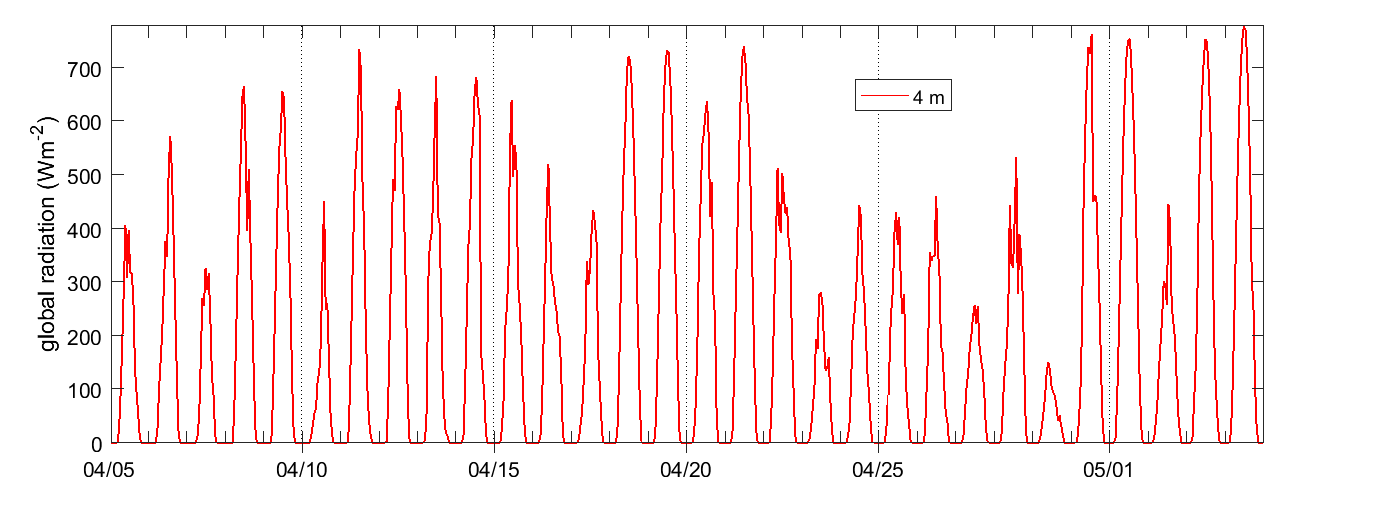
air temperature
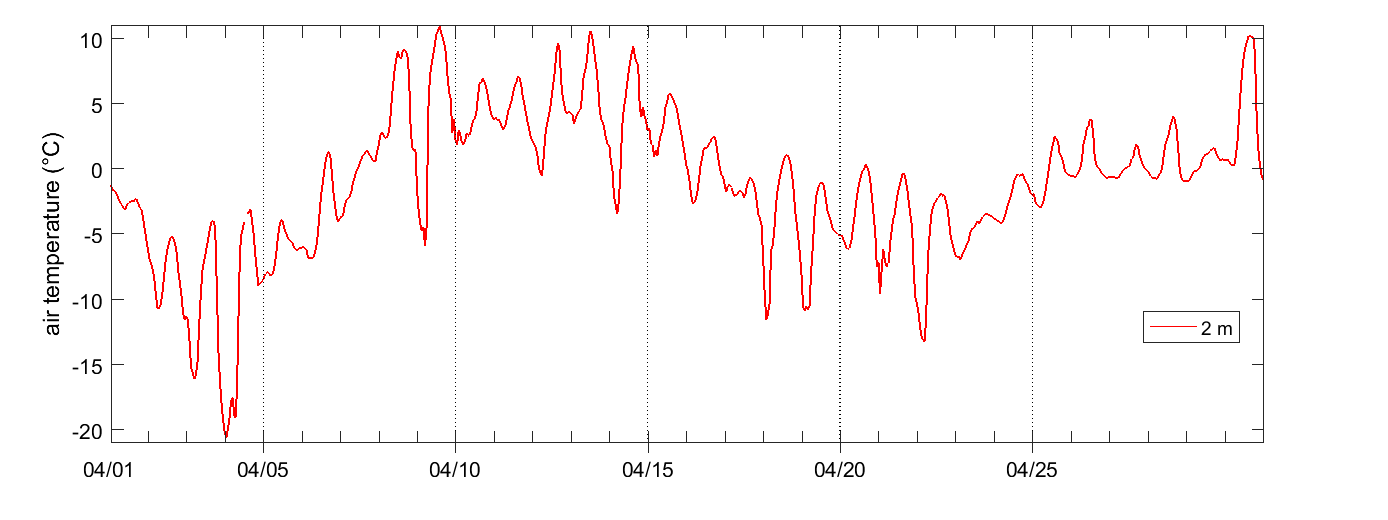
precipitation
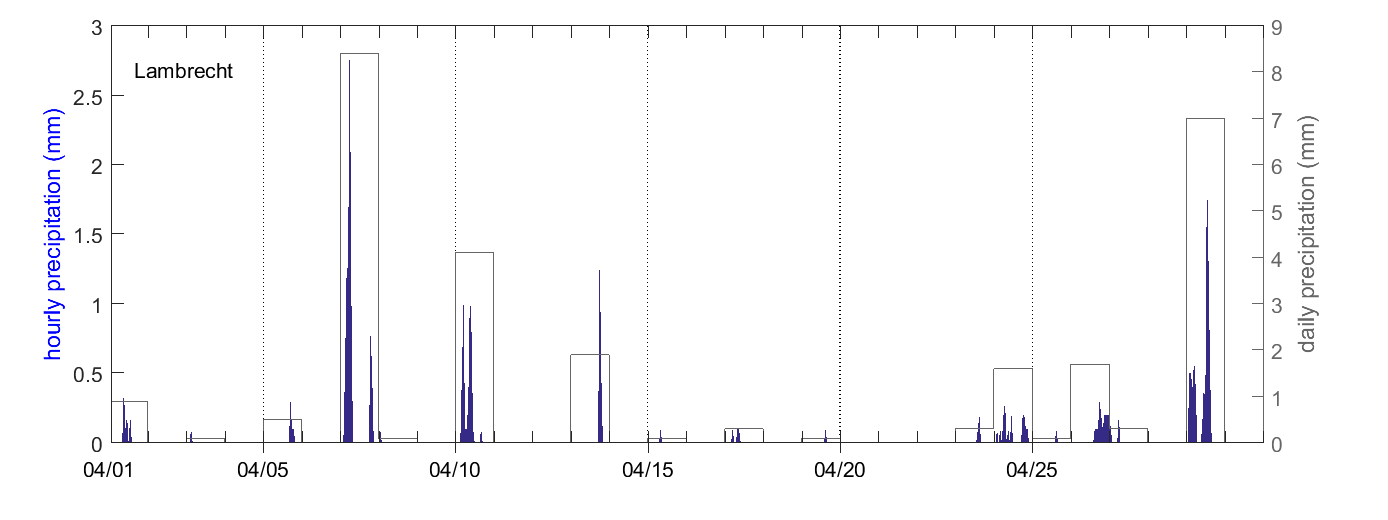
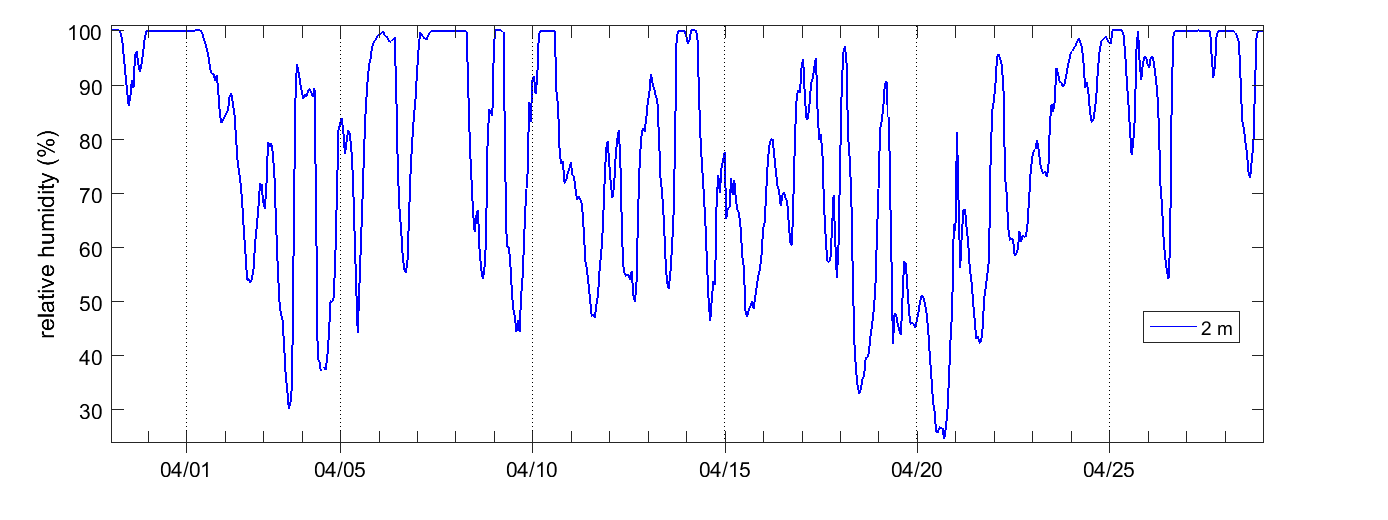
relative humidity
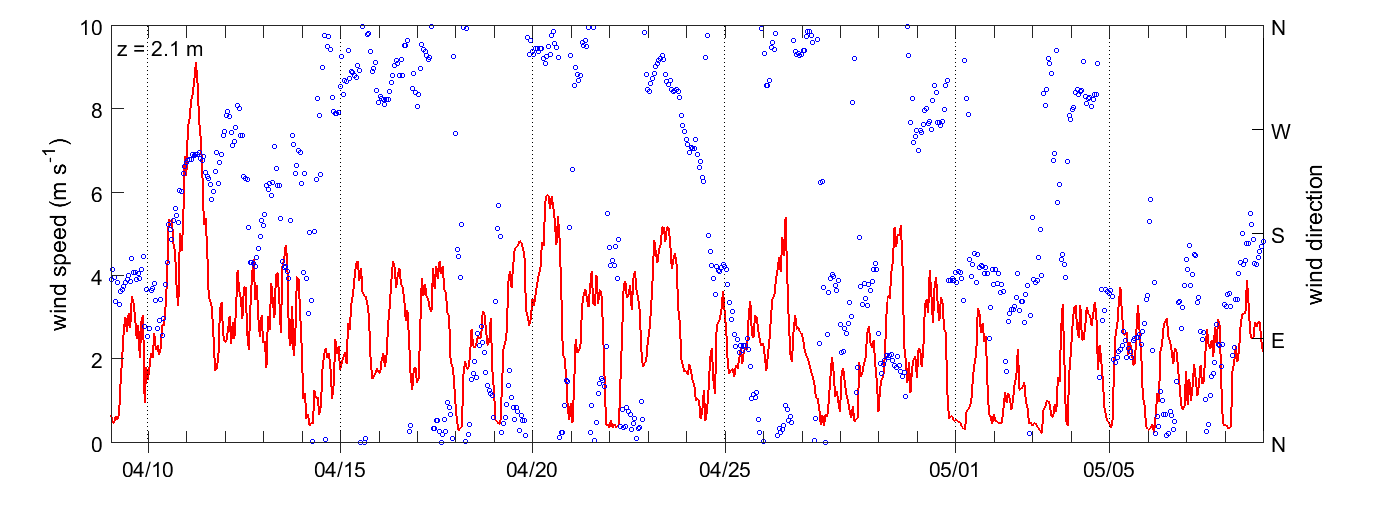
wind speed and direction
air pressure
currently no graph available
CO2 flux and mixing ratio (LI-COR)
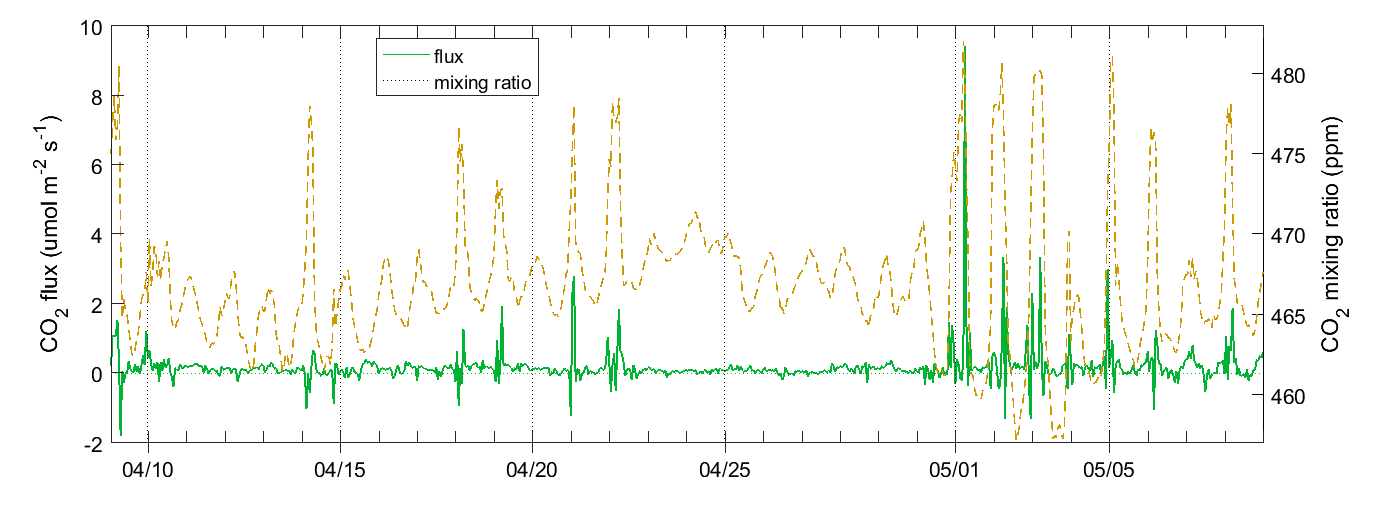
The eddy-covariance fluxes are raw data calculated by the Swedish National Network. Data are displayed without further quality flag filtering.
CO2 flux and mixing ratio (LGR)
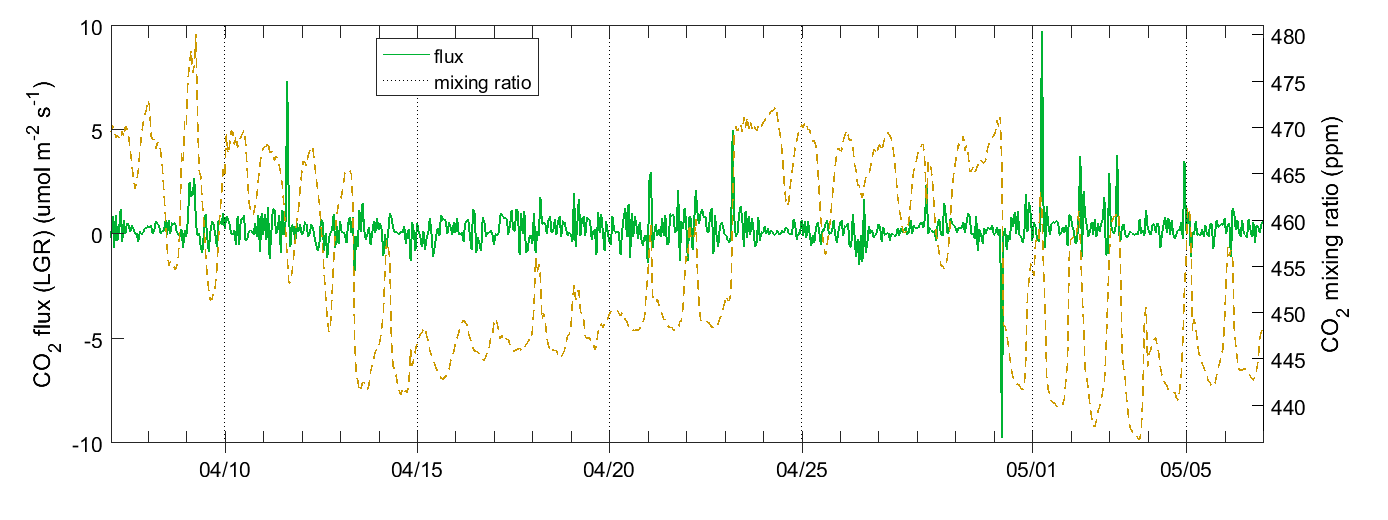
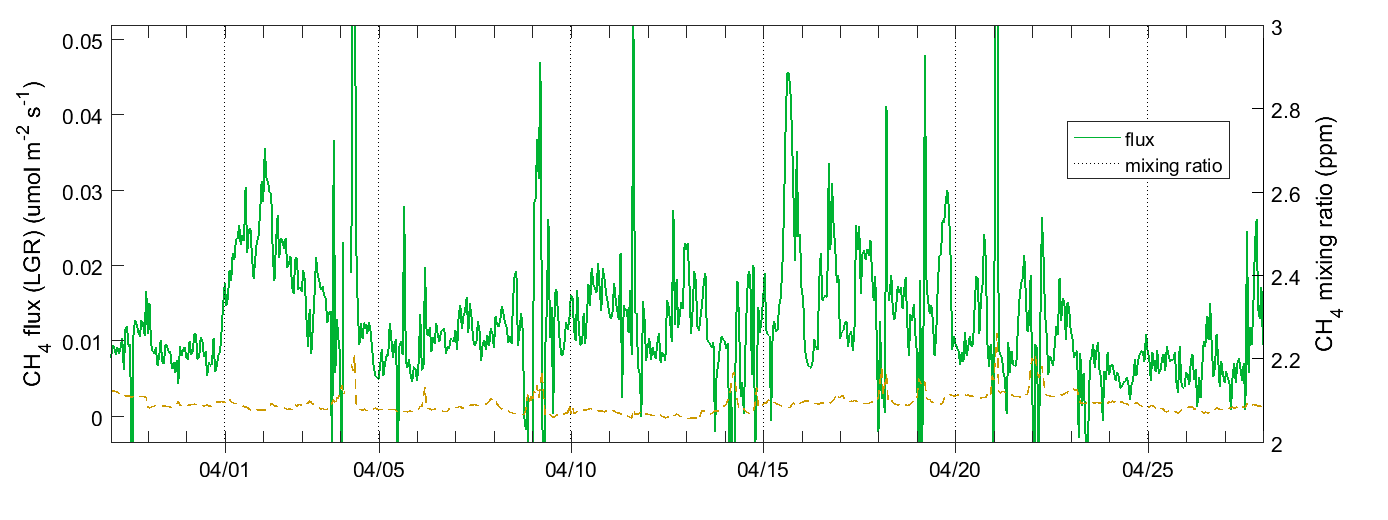
CH4 flux and mixing ratio (LGR)
phenocam
Degero | ||
|
The eddy-covariance fluxes are raw data calculated by the Swedish National Network. Data are displayed without further quality flag filtering.
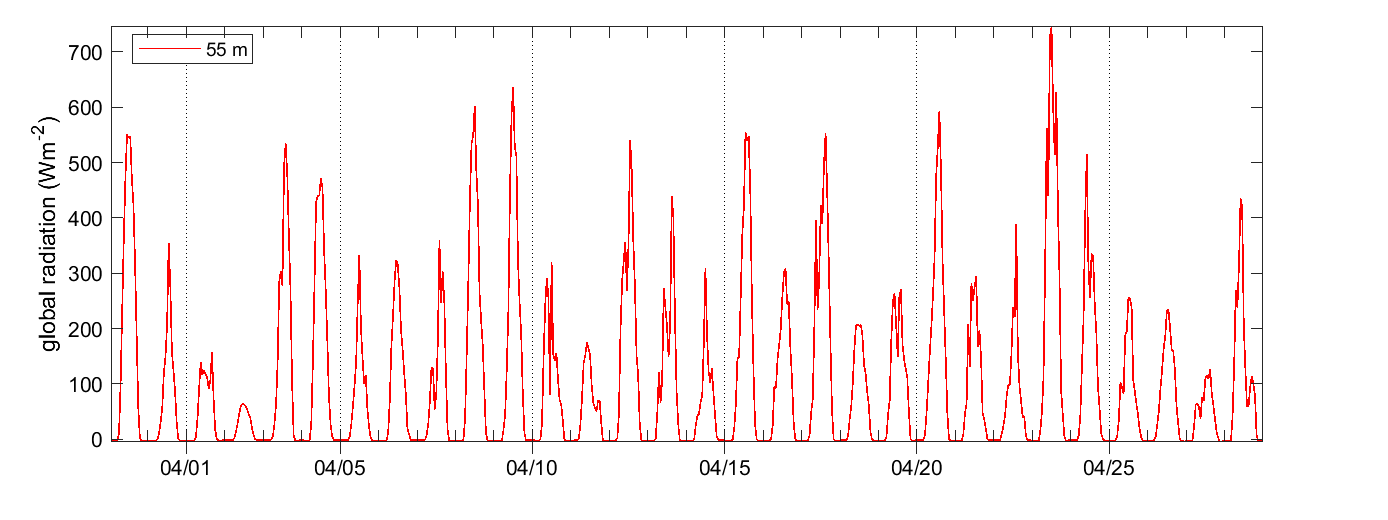
solar radiation
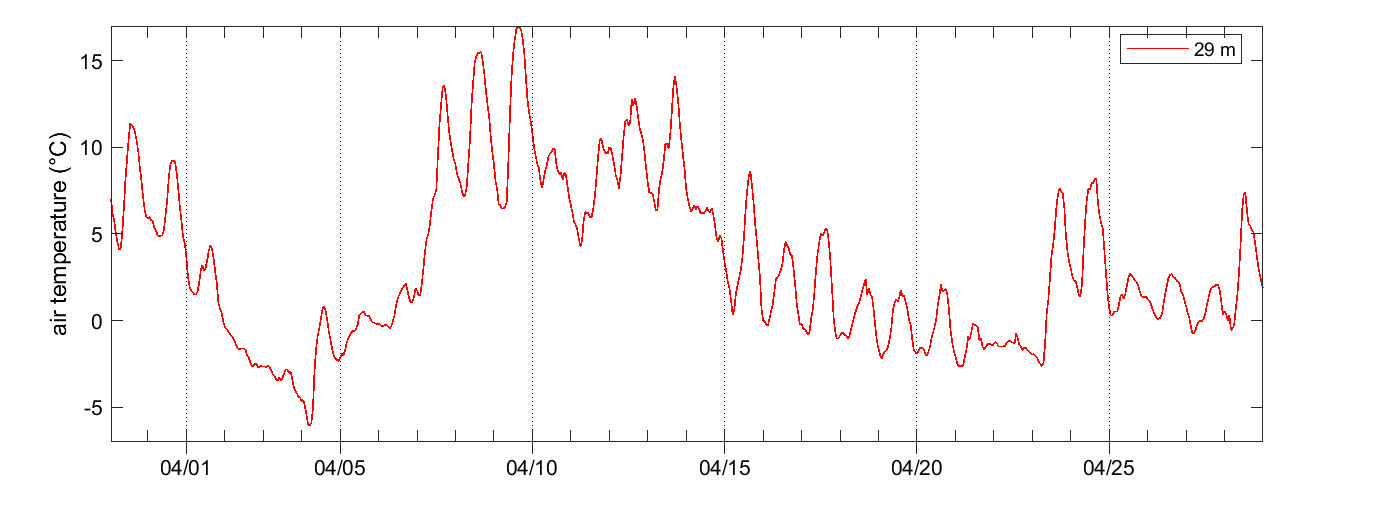
air temperature
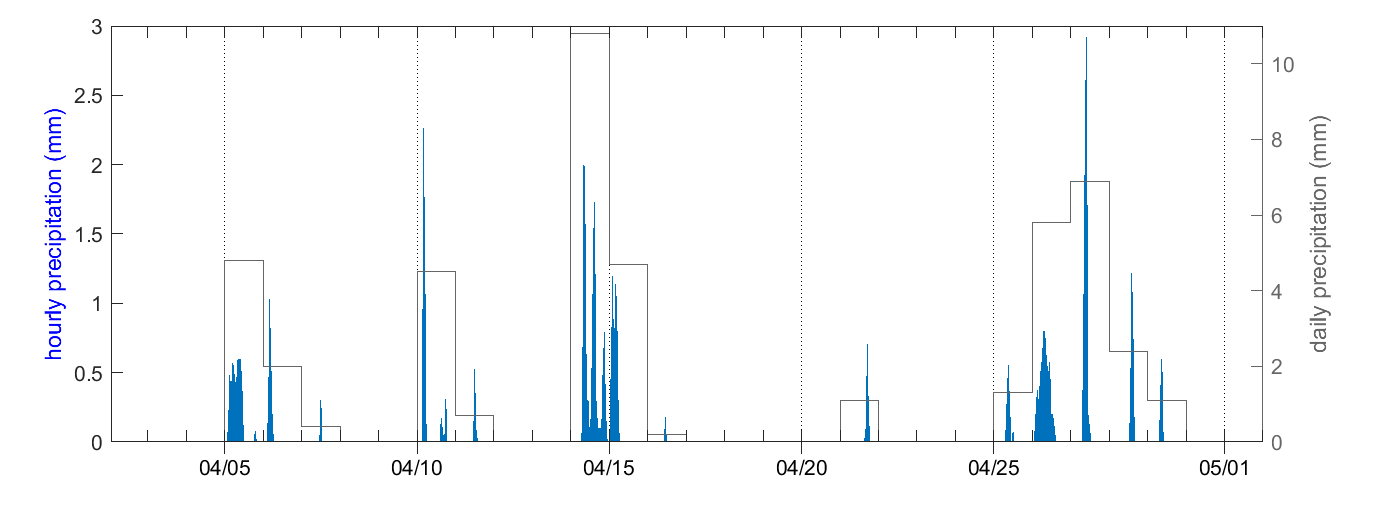
precipitation
relative humidity
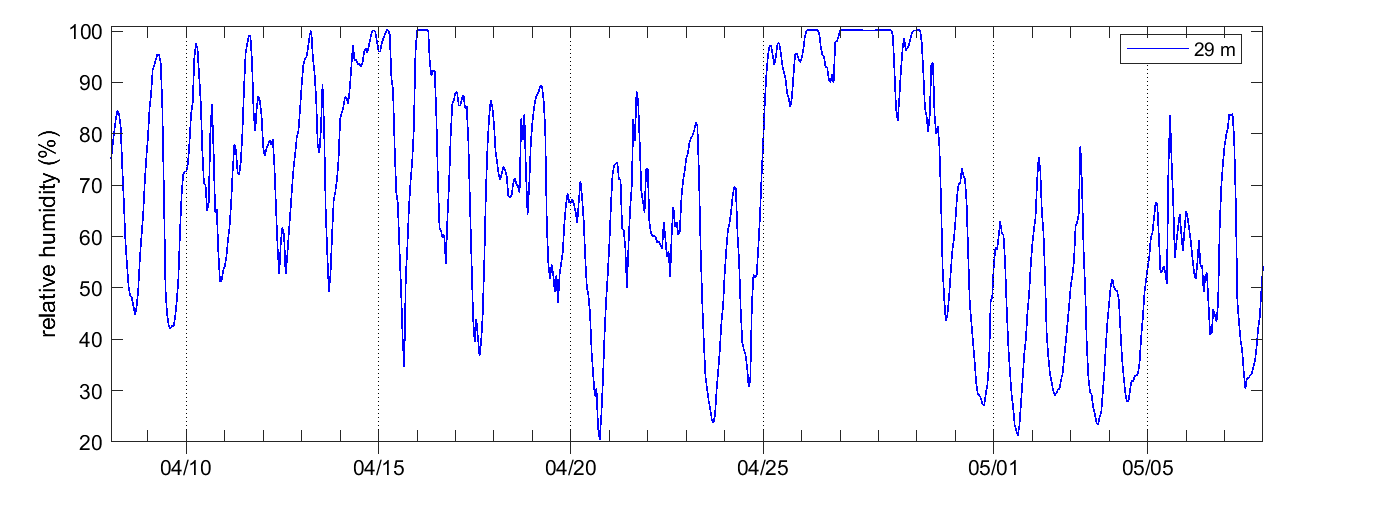
wind speed and direction
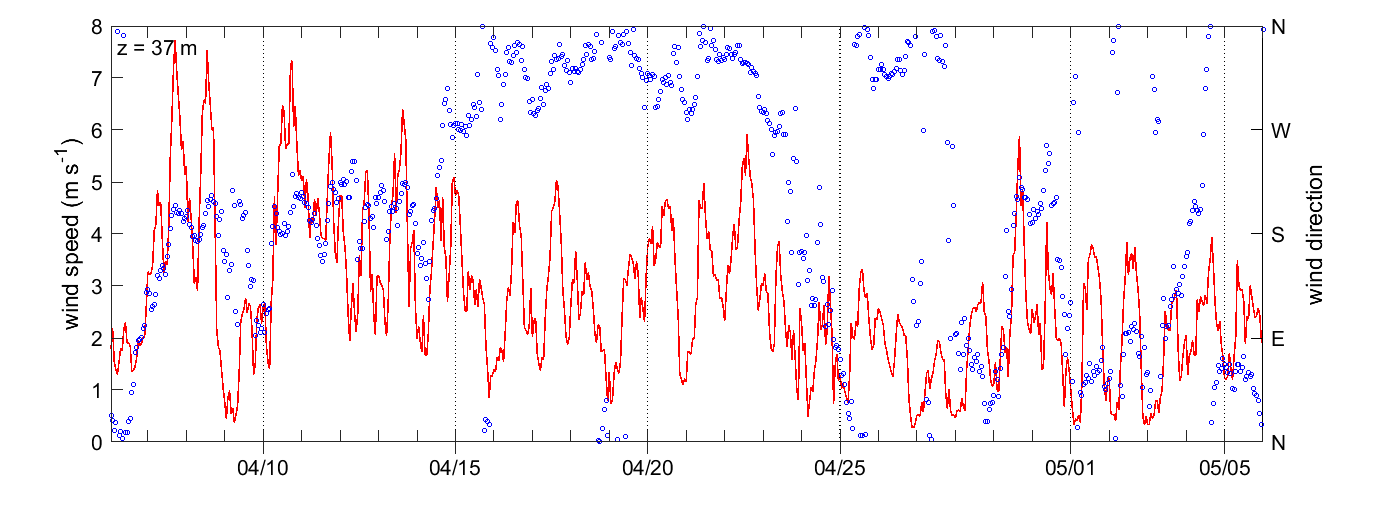
air pressure
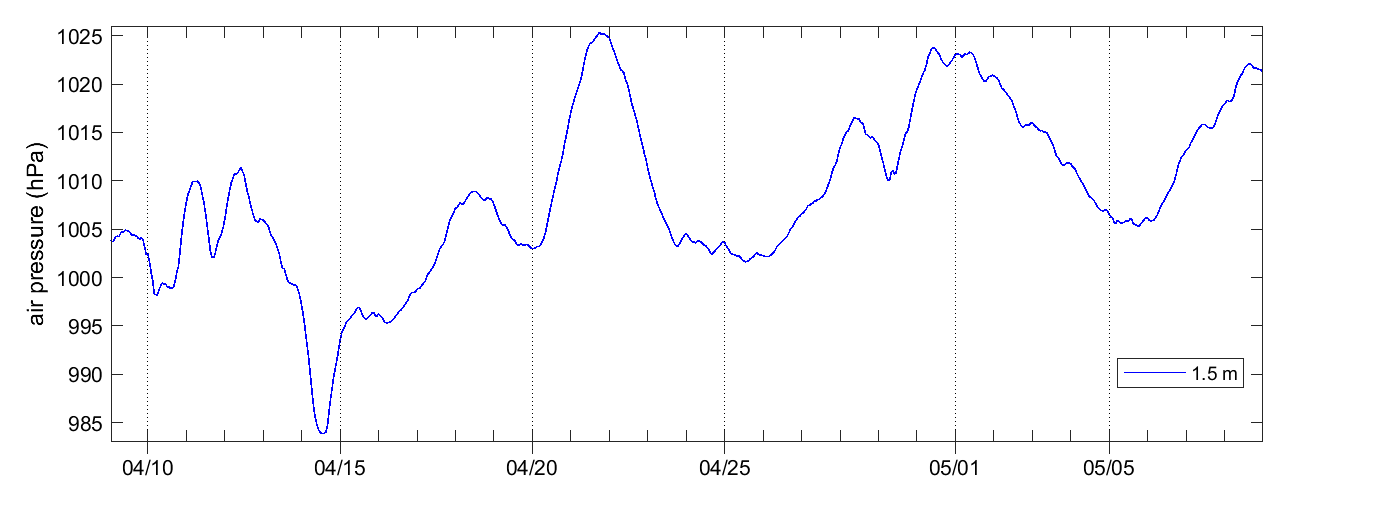
CO2 flux and mixing ratio
The eddy-covariance fluxes are raw data calculated by the Swedish National Network. Data are displayed without further quality flag filtering.
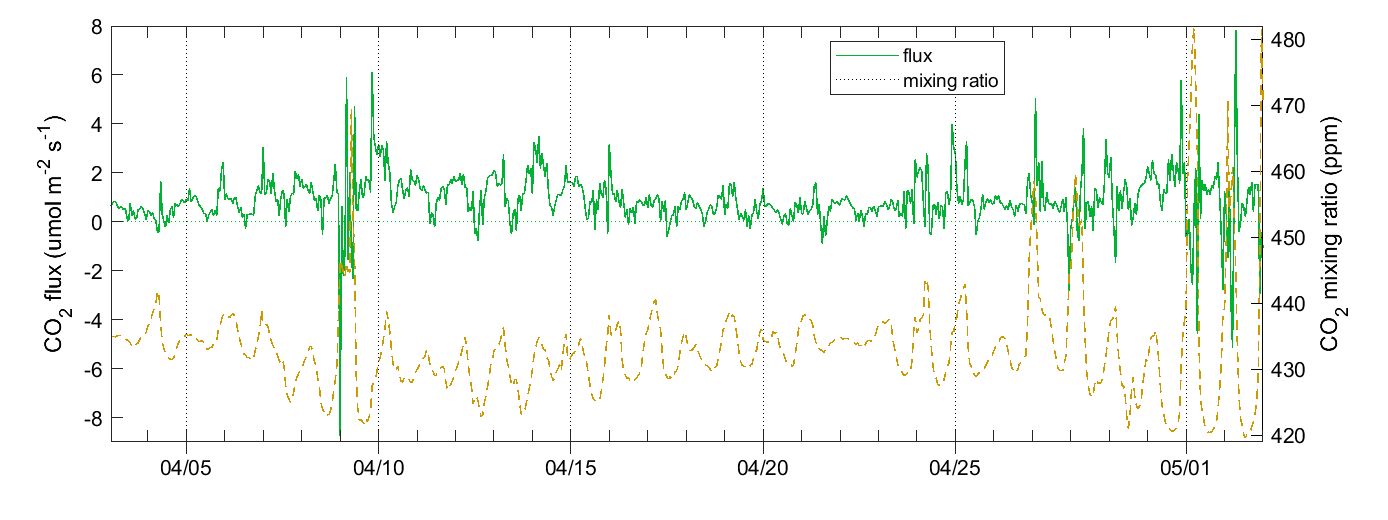
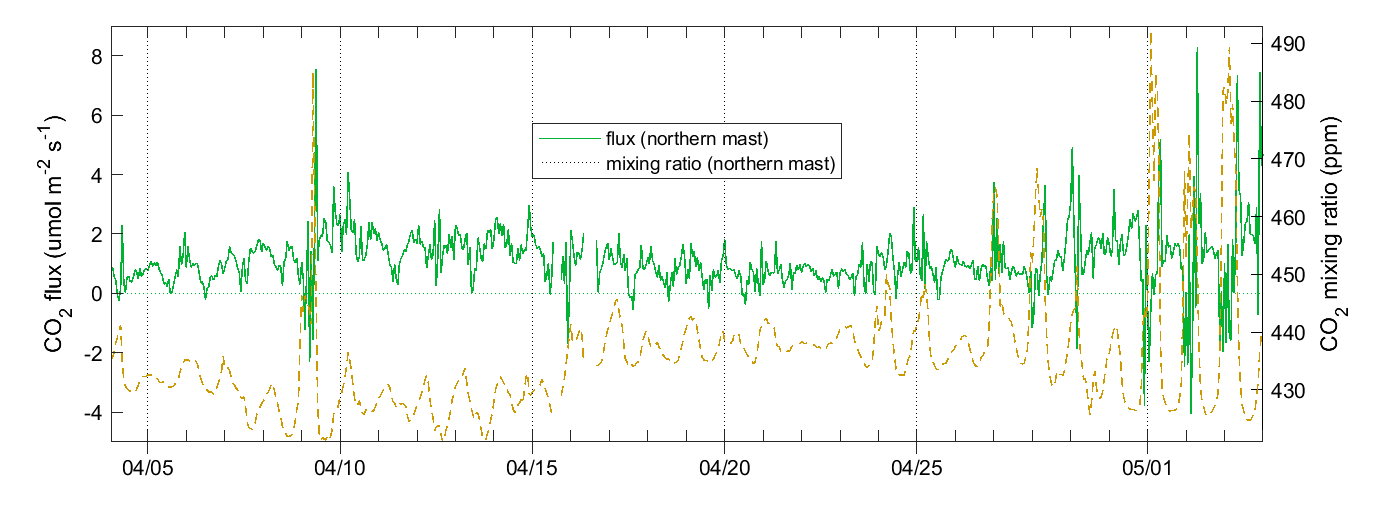
CO2 flux and mixing ratio/northern mast
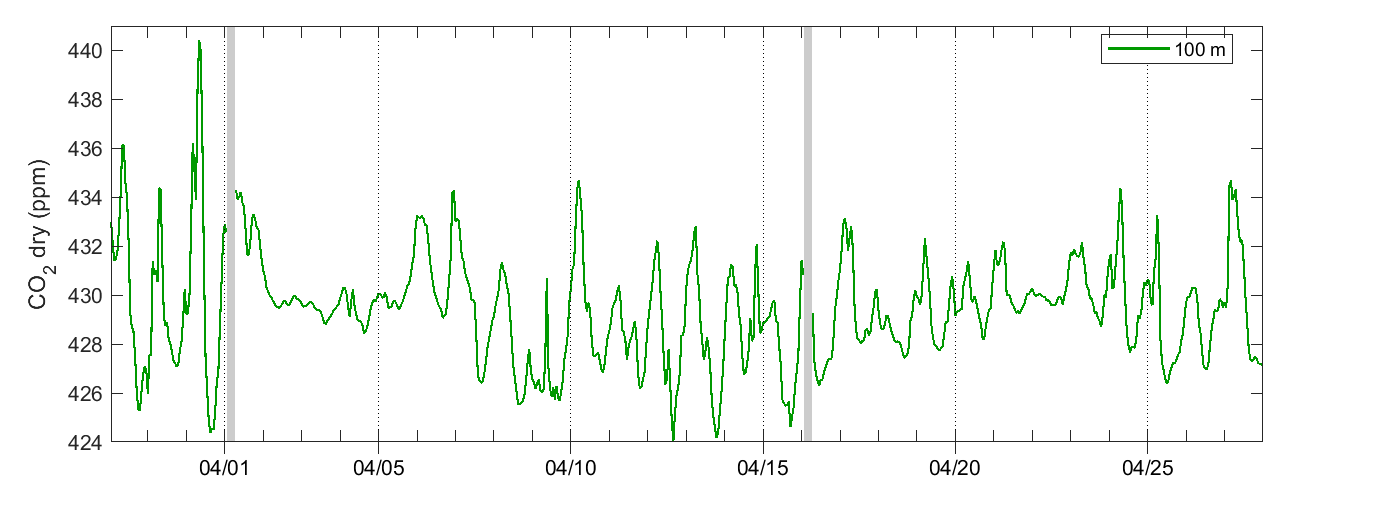
CO2 concentration
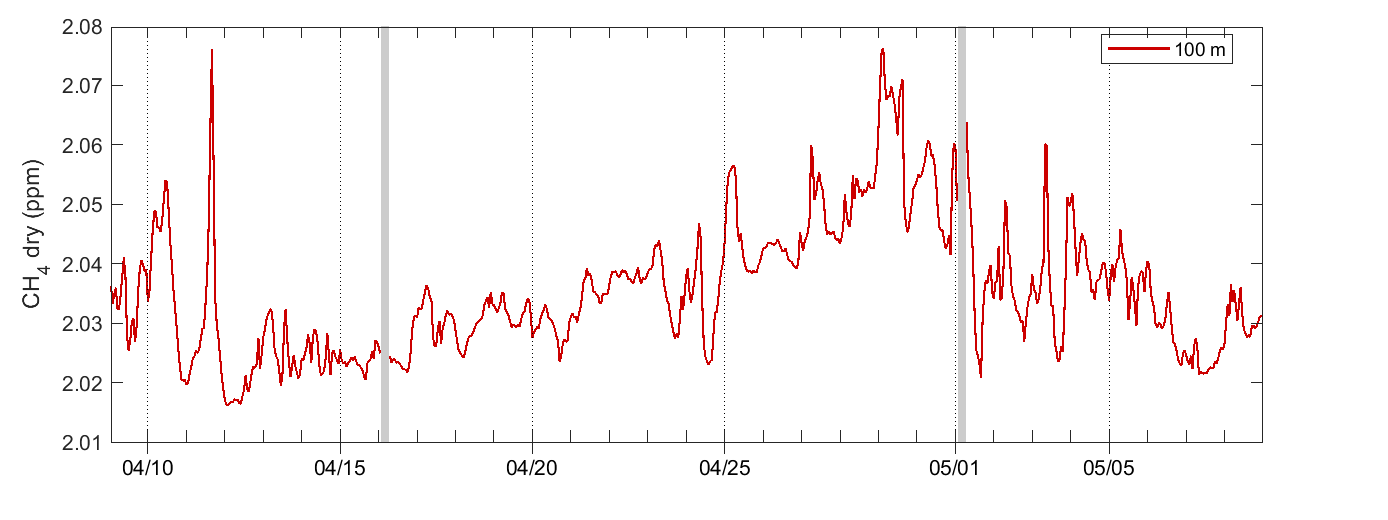
CH4 concentration
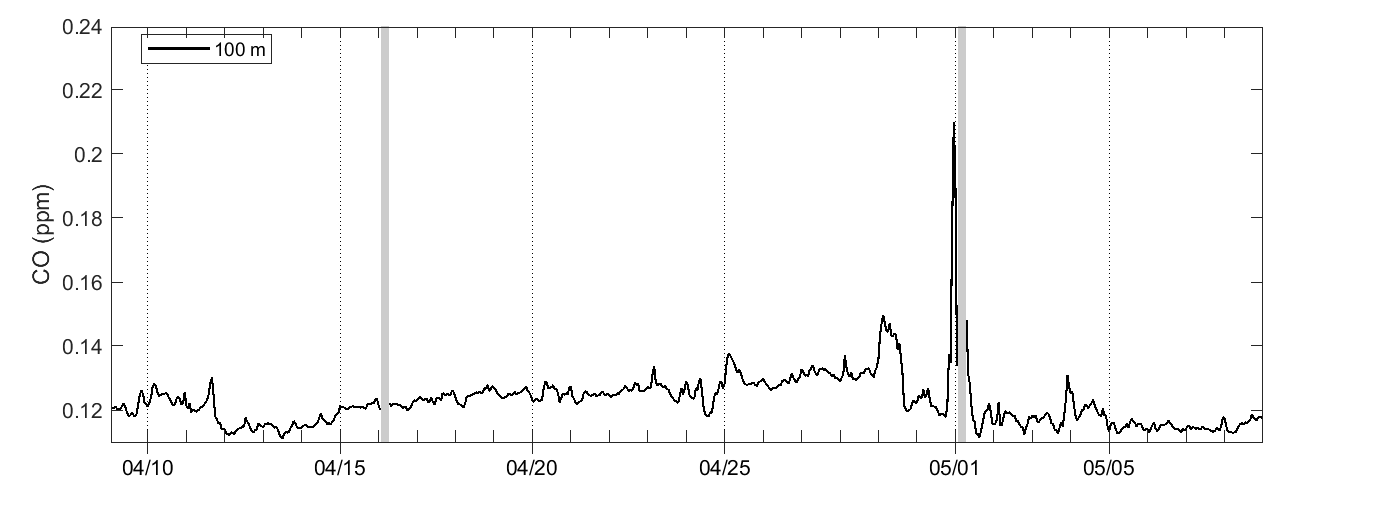
CO concentration
phenocam
Norunda – upper cam | Norunda – lower cam | |
|
|
The eddy-covariance fluxes are raw data calculated by the Swedish National Network. Data are displayed without further quality flag filtering.
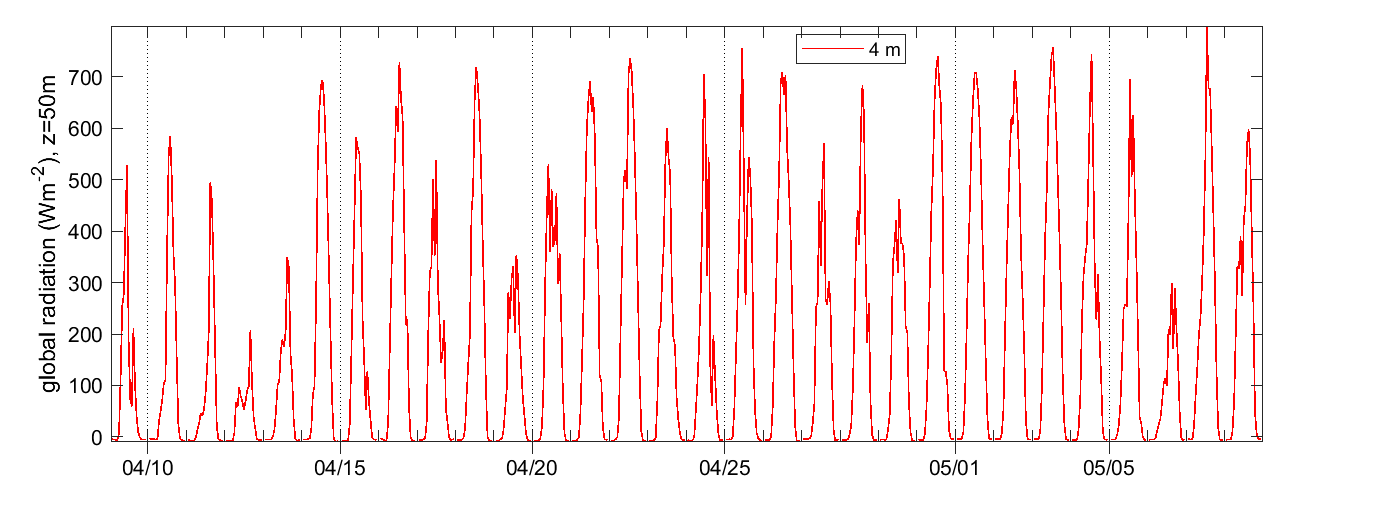
solar radiation
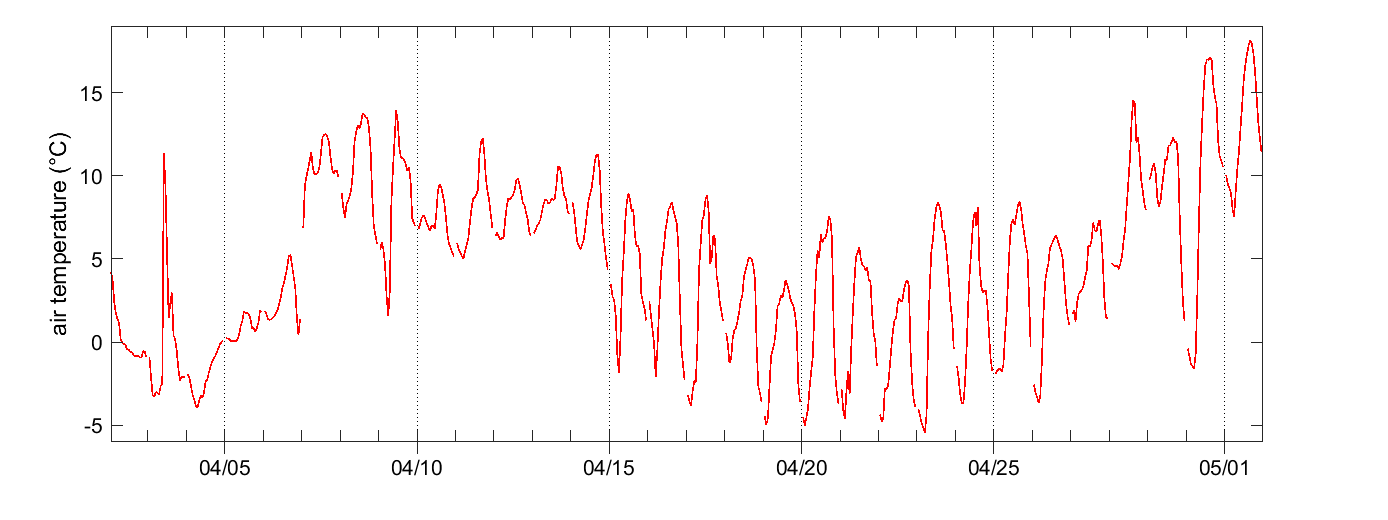
air temperature
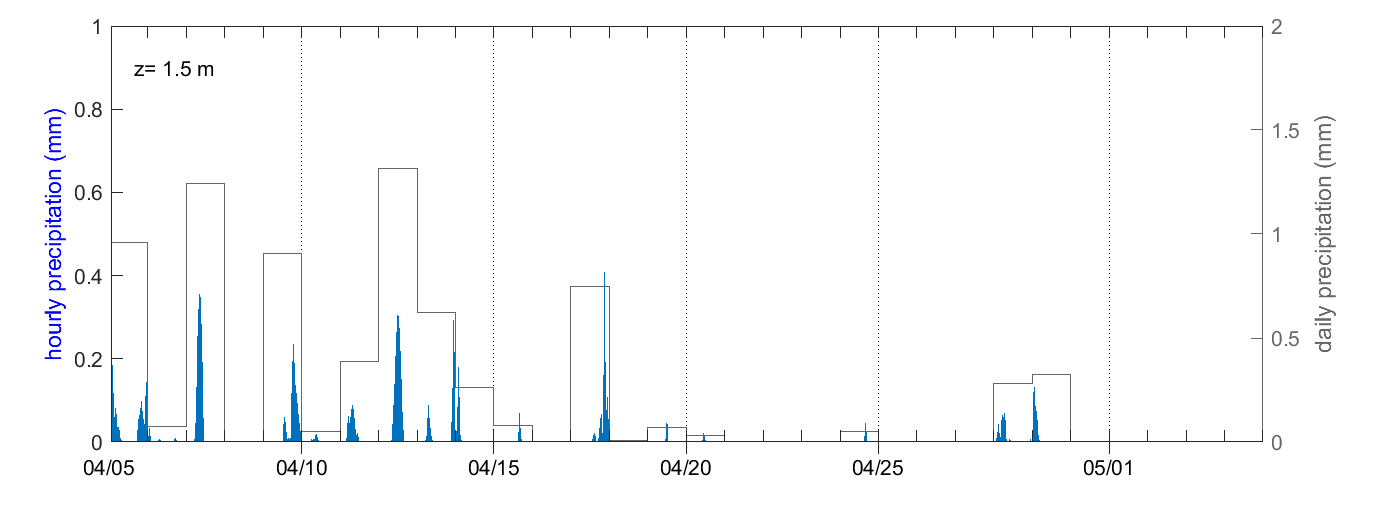
precipitation
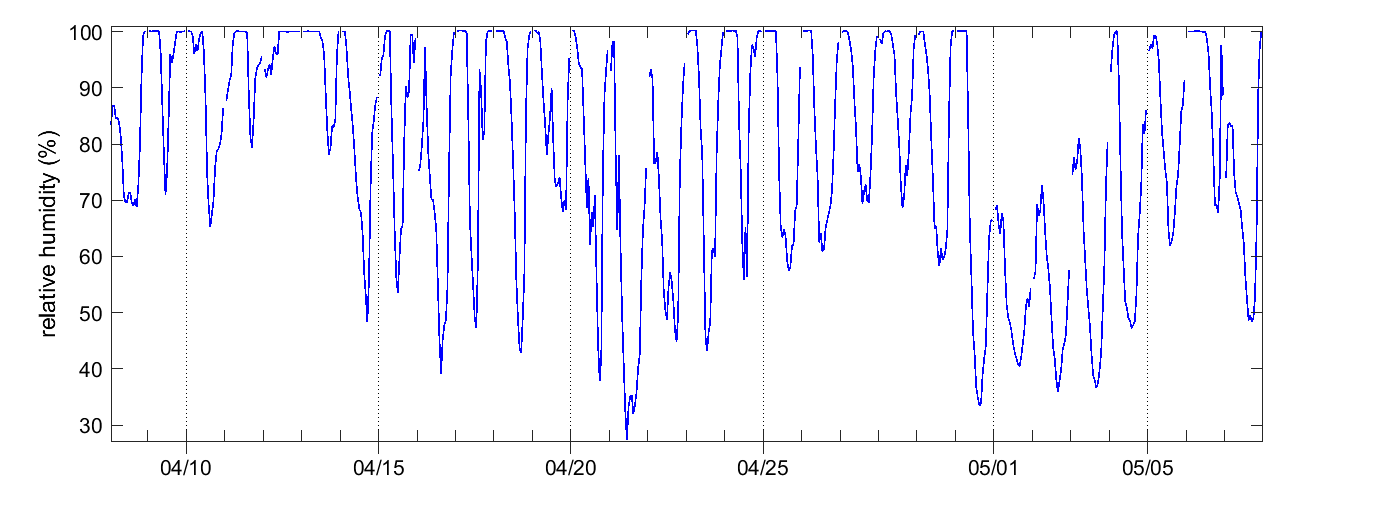
relative humidity
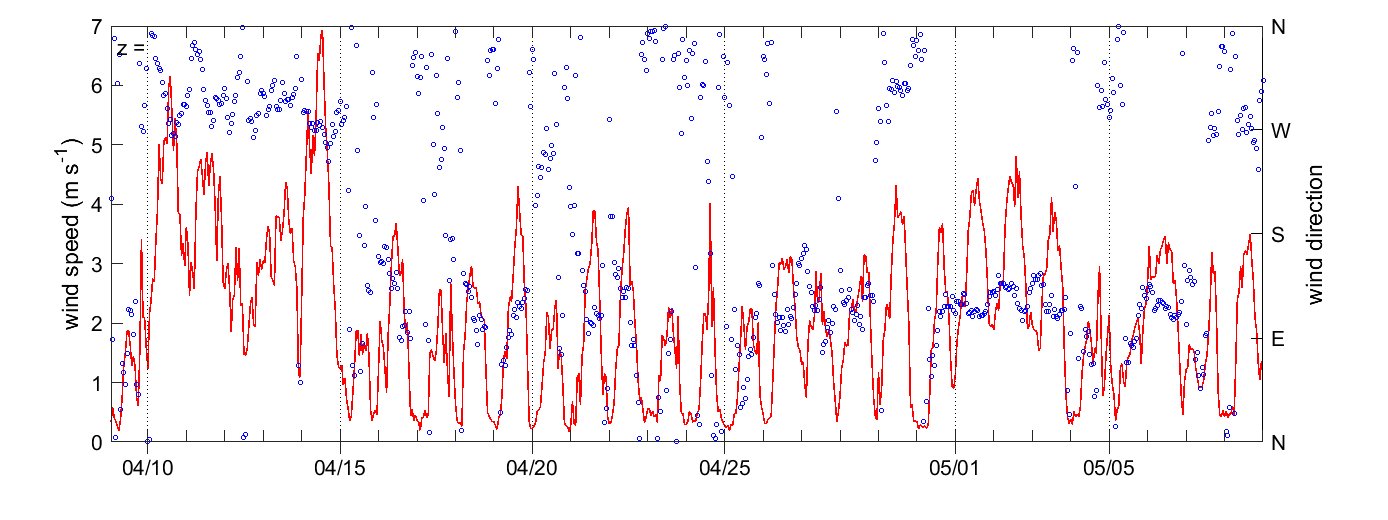
wind speed and direction
CO2 flux and mixing ratio (LI-COR)
The eddy-covariance fluxes are raw data calculated by the Swedish National Network. Data are displayed without further quality flag filtering.
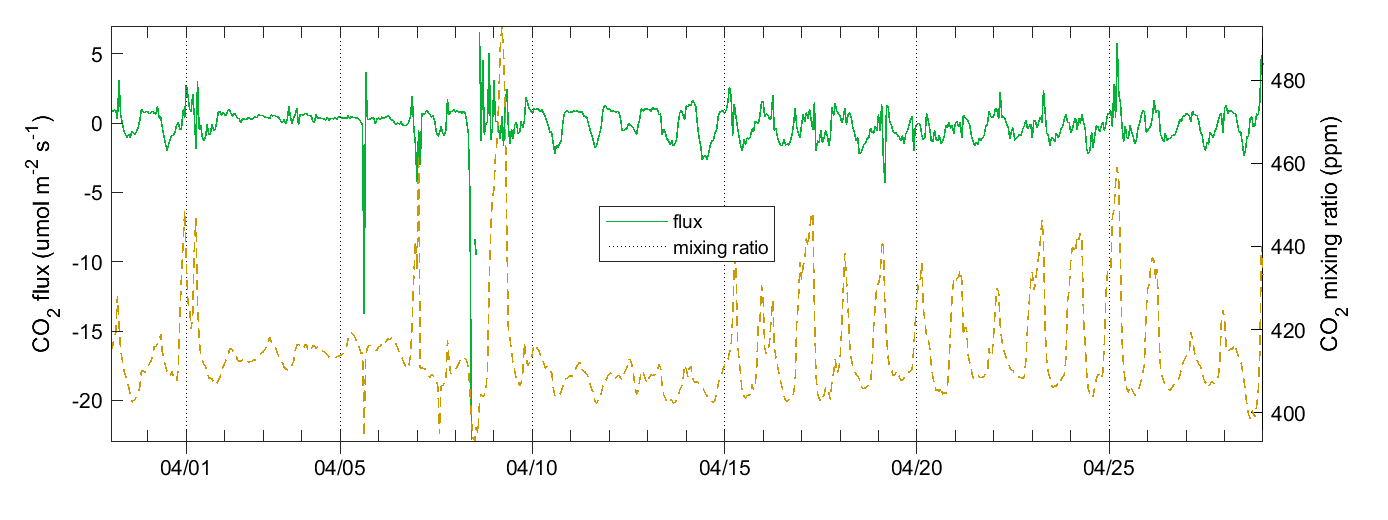
CO2 flux and mixing ratio
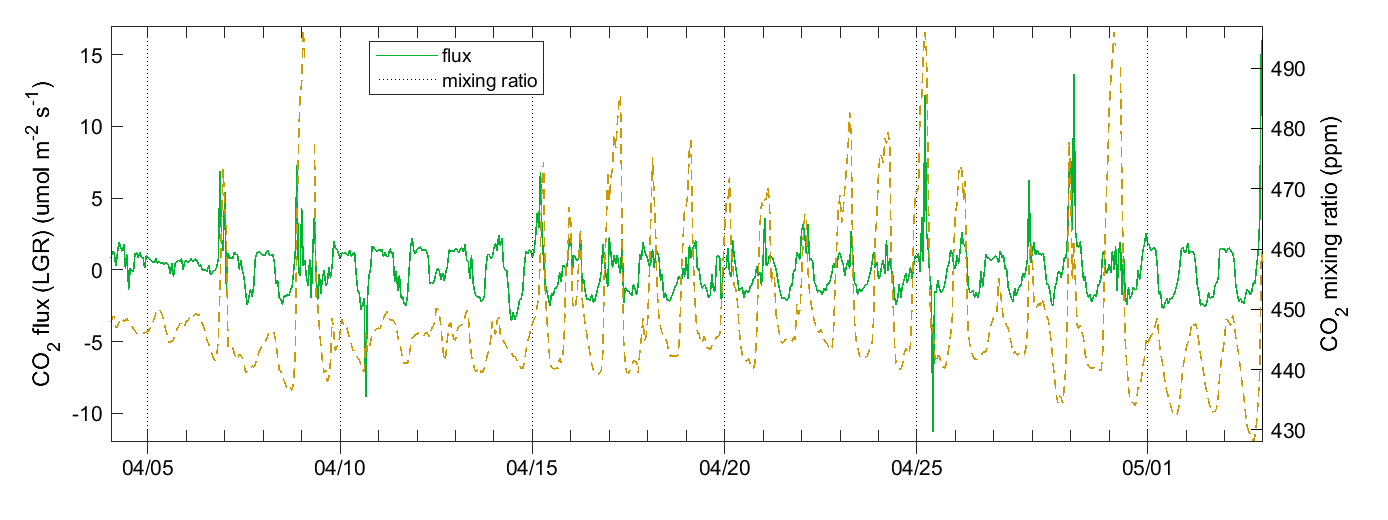
CO2 flux and mixing ratio (LGR)
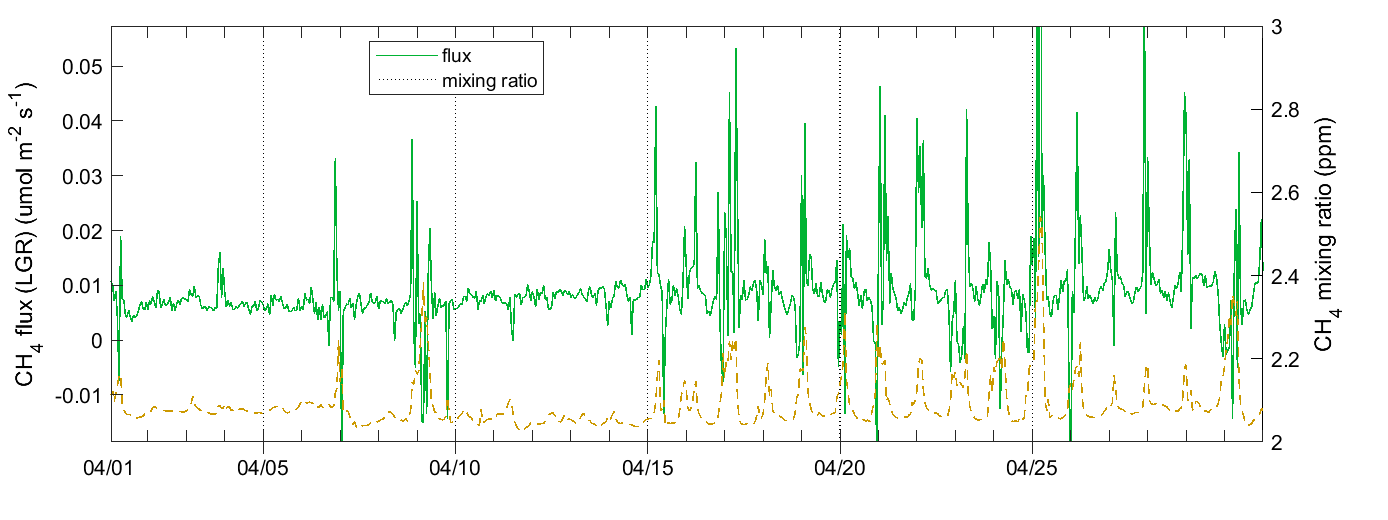
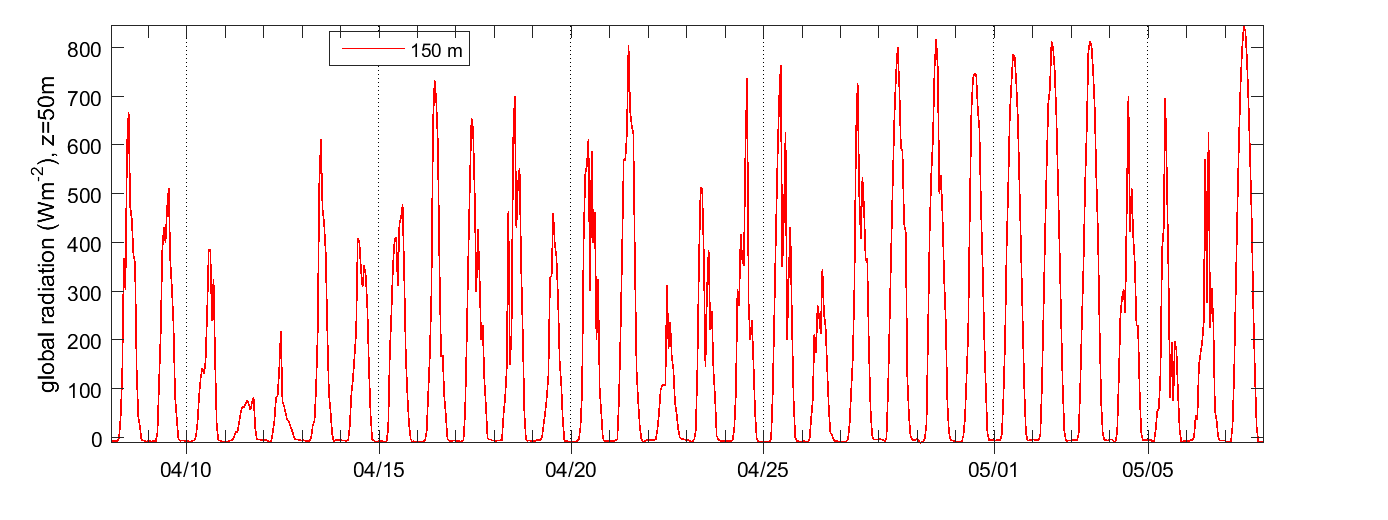
solar radiation
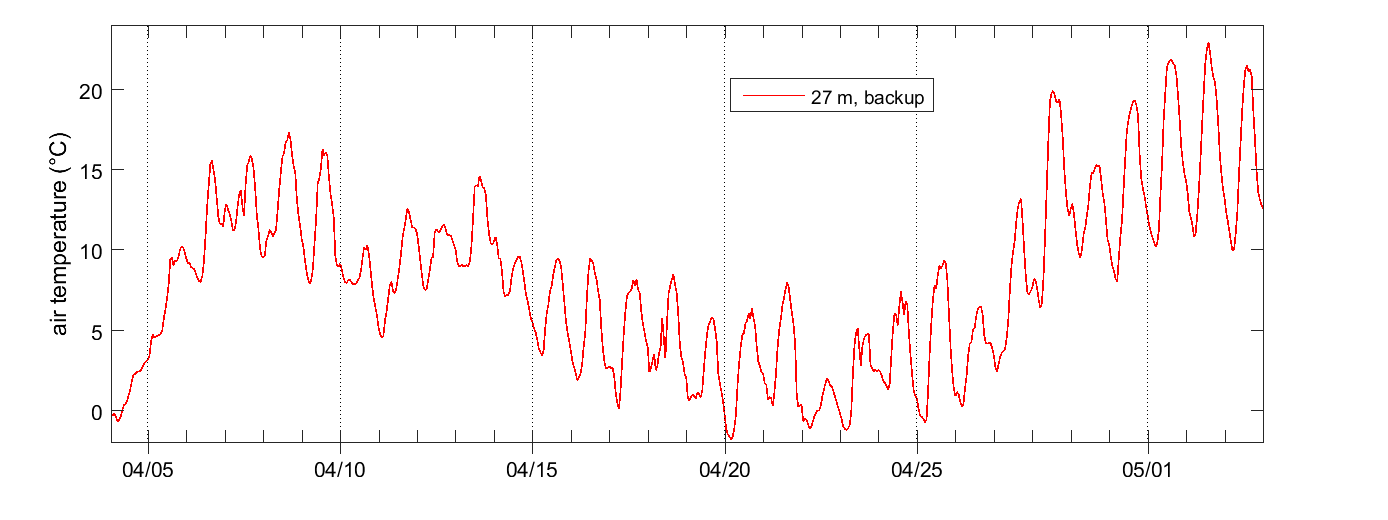
air temperature
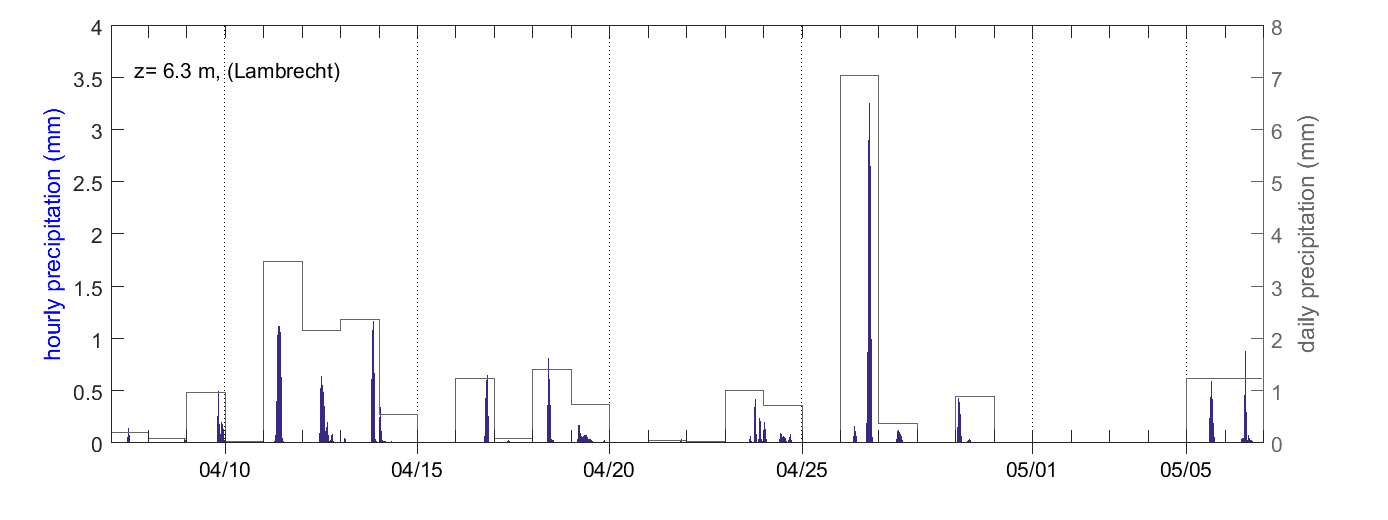
precipitation
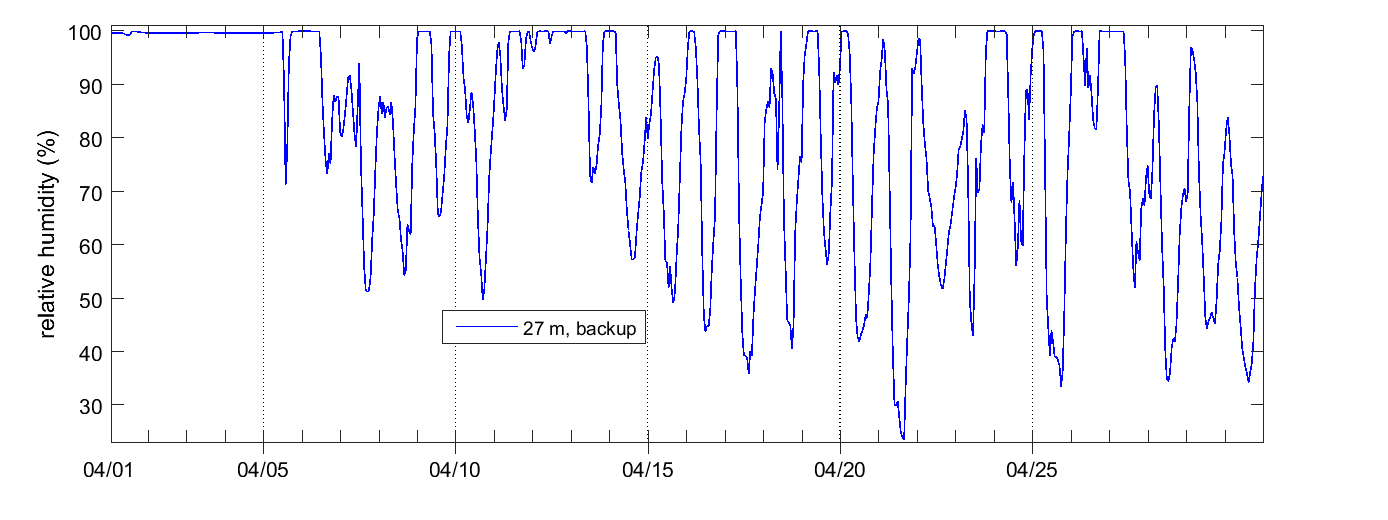
relative humidity
wind speed and direction
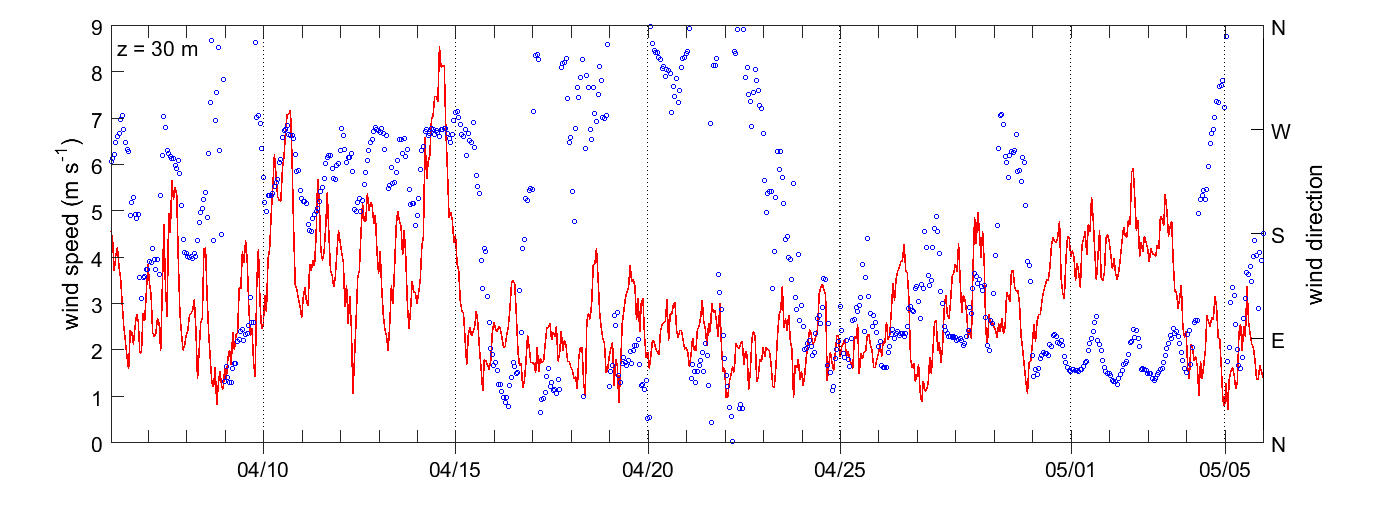
air pressure
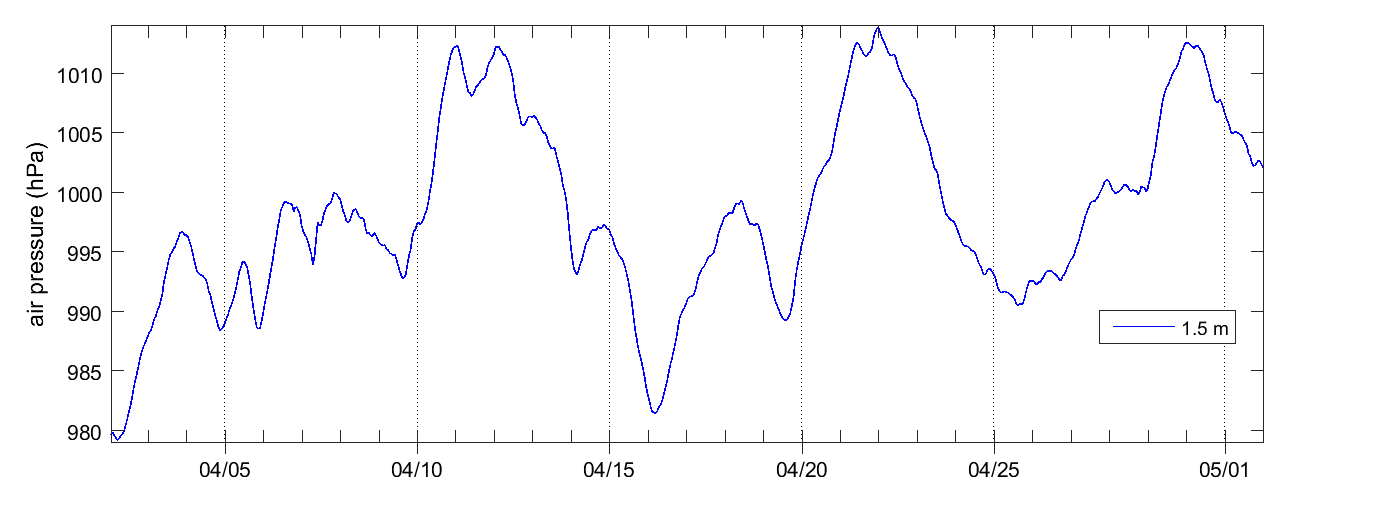
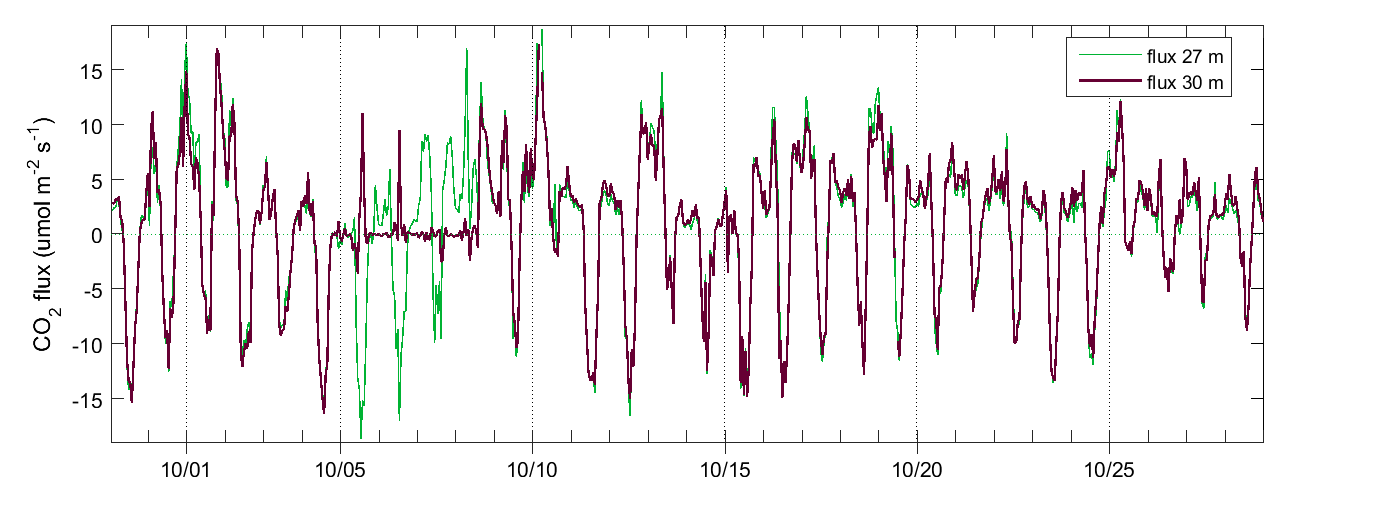
CO2 flux and mixing ratio
The eddy-covariance fluxes are raw data calculated by the Swedish National Network. Data are displayed without further quality flag filtering.
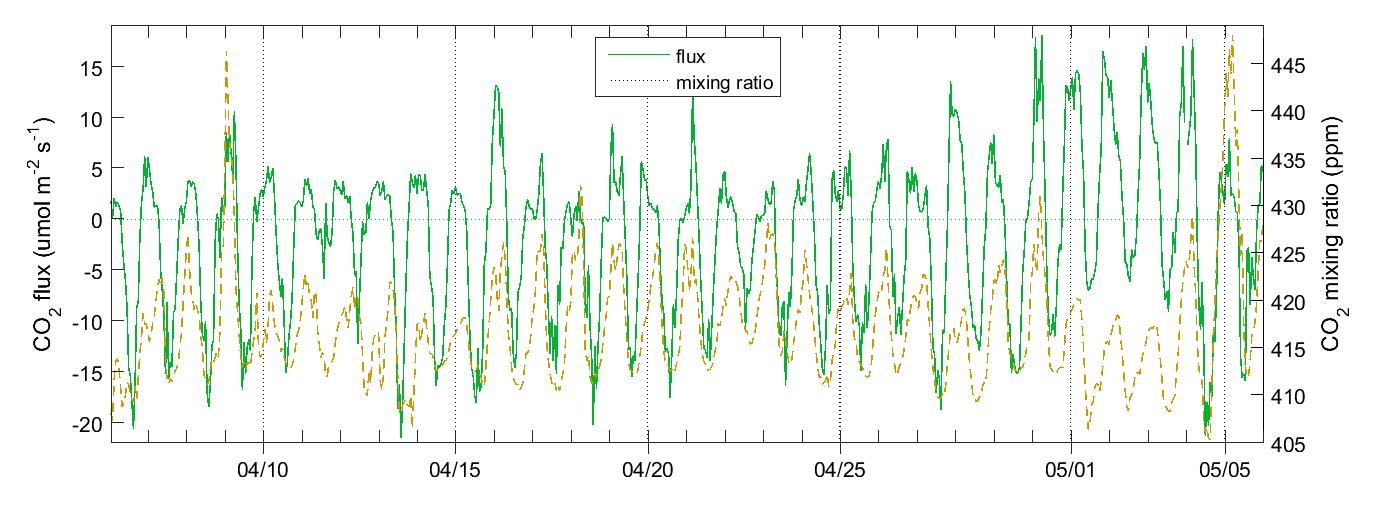
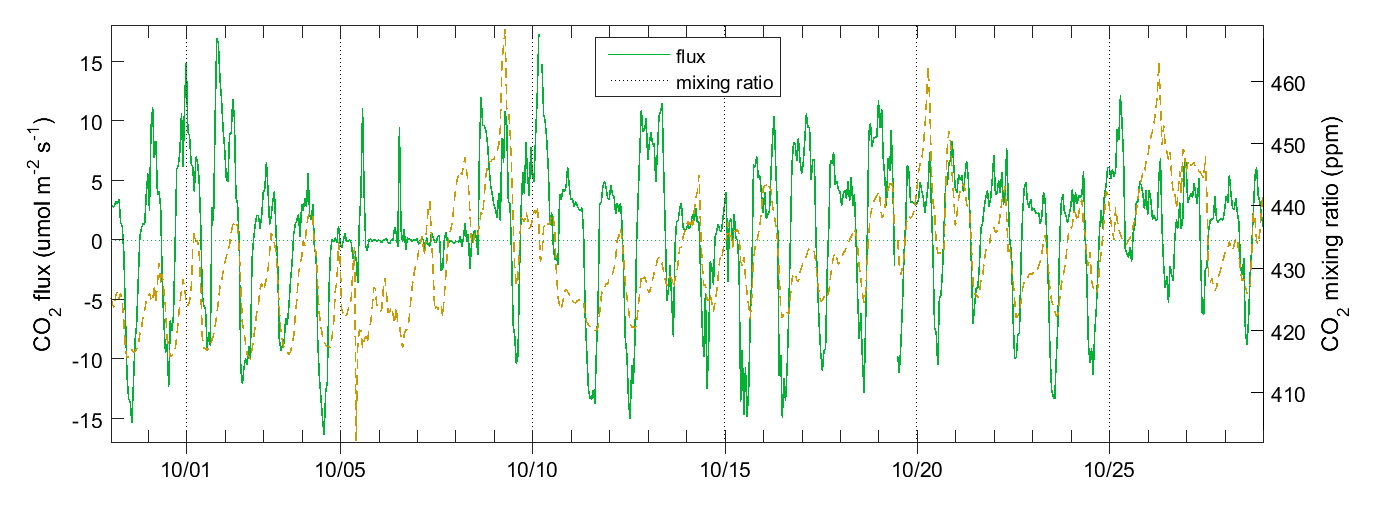
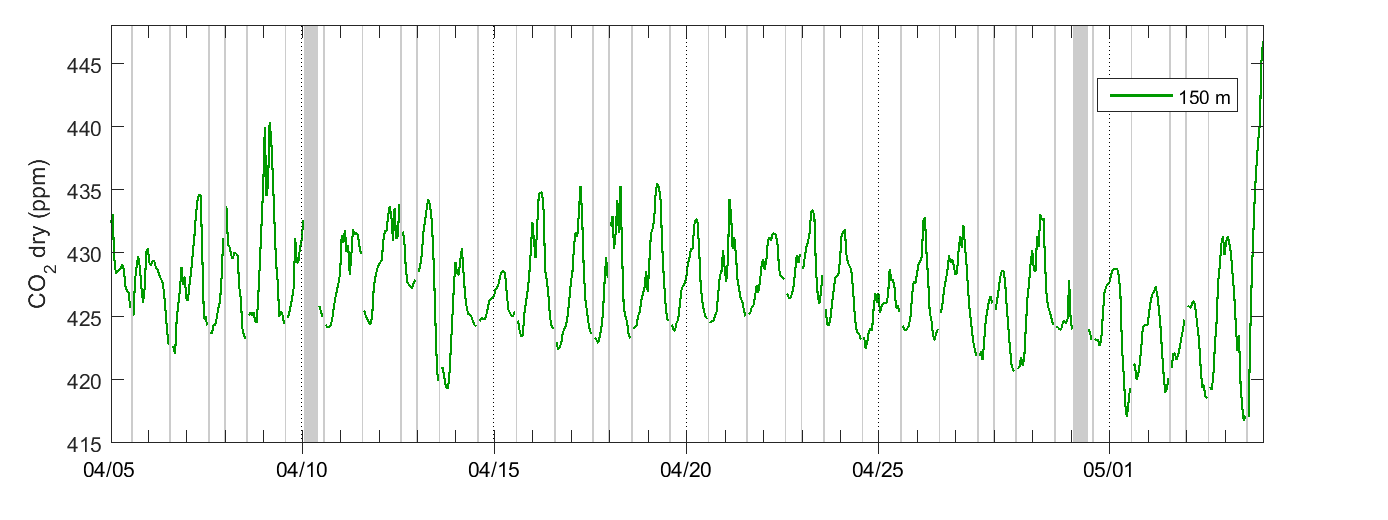
CO2 concentration
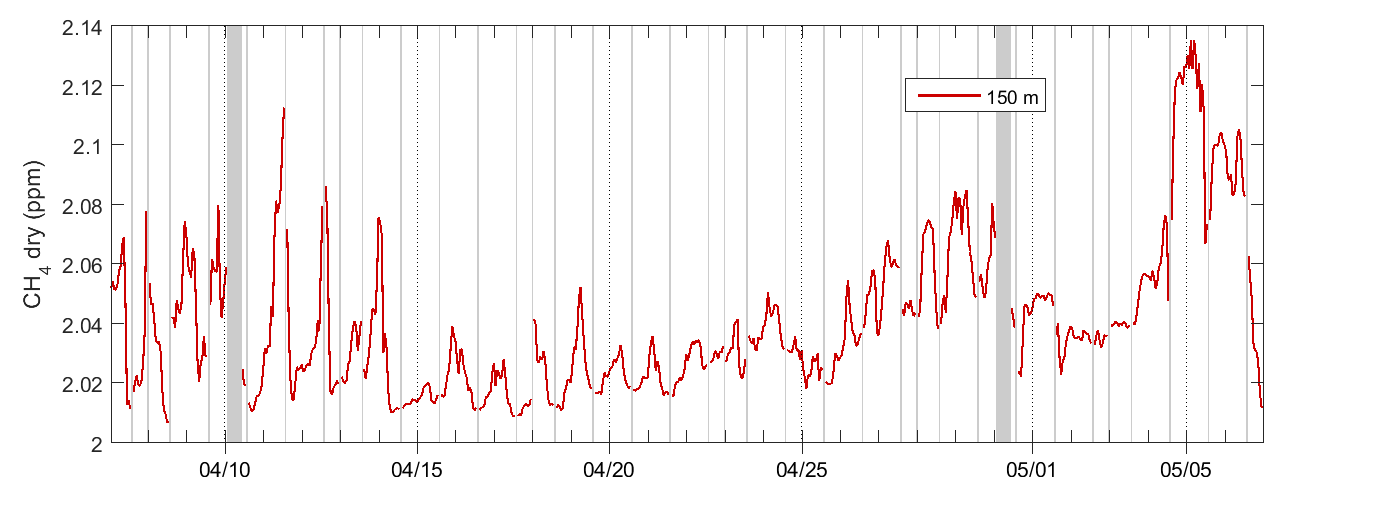
CH4 concentration
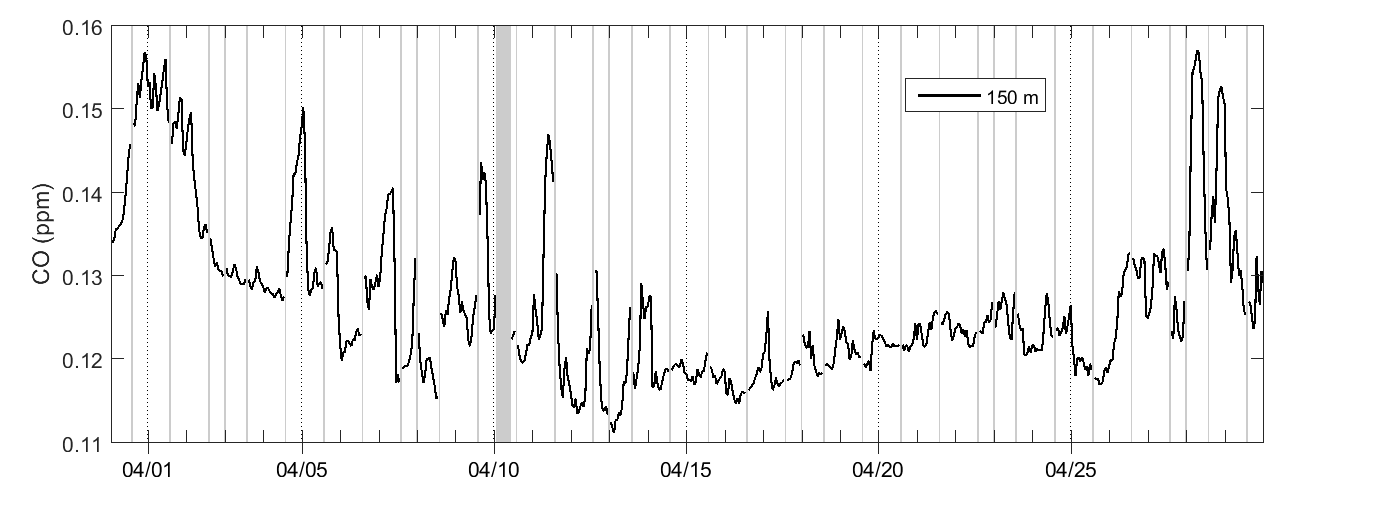
CO concentration
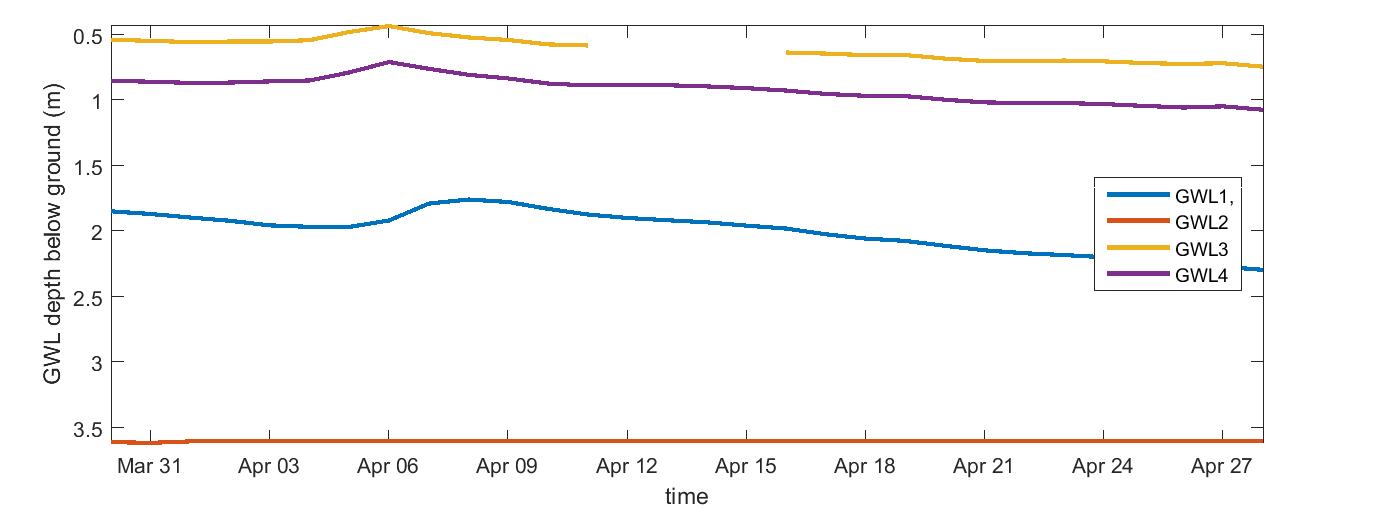
ground water level
phenocam
Hyltemossa – Above canopy | Hyltemossa – Below canopy | |
|
|
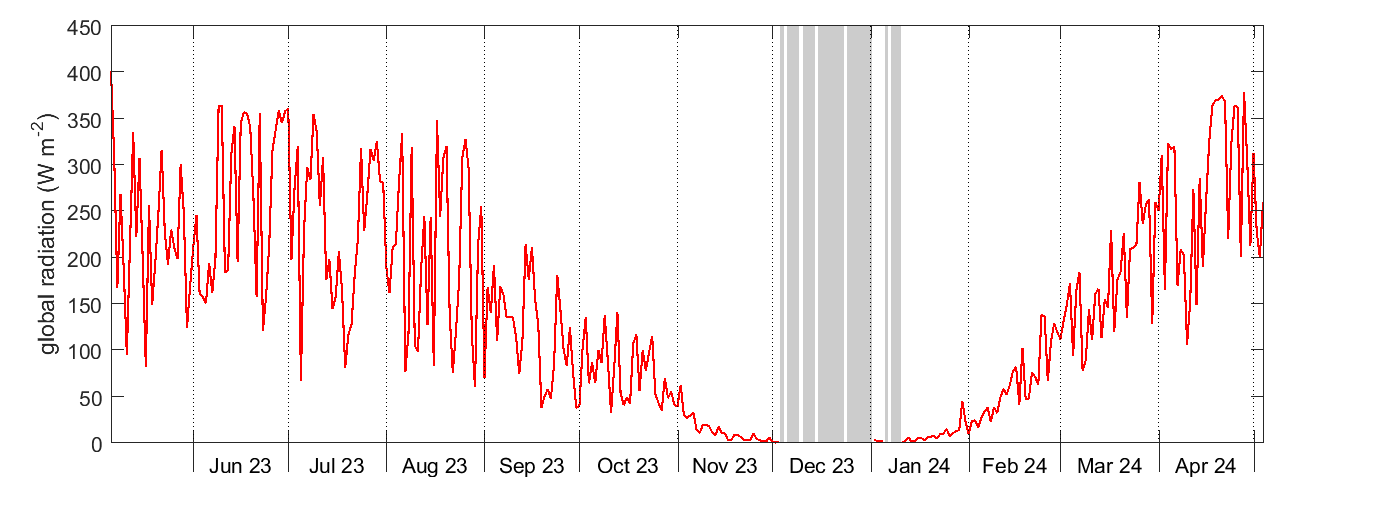
solar radiation
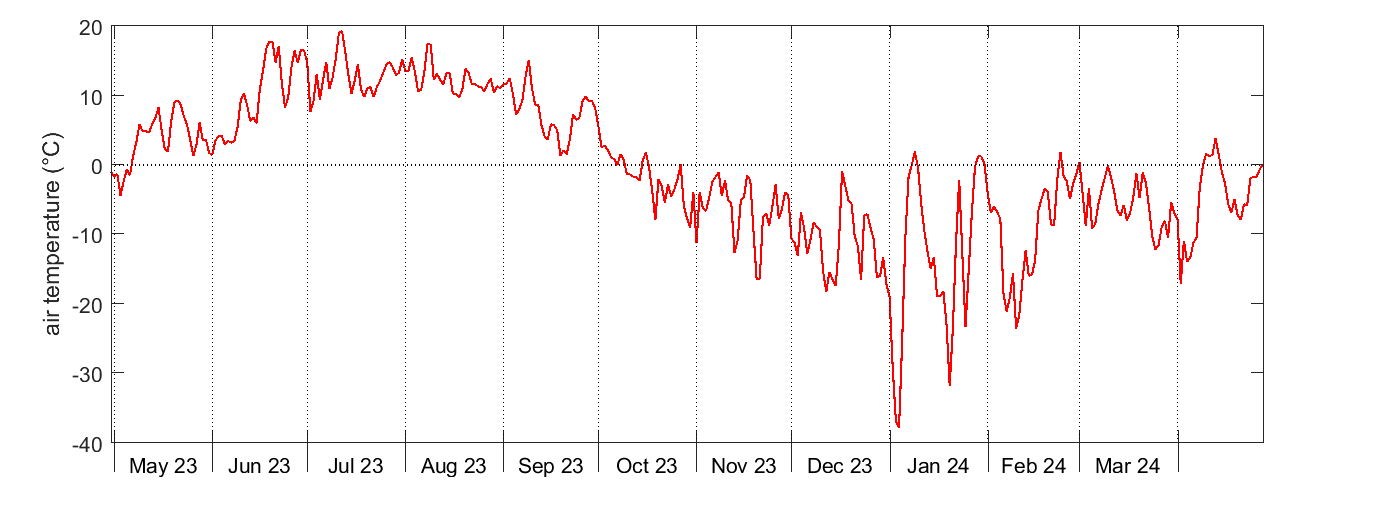
air temperature
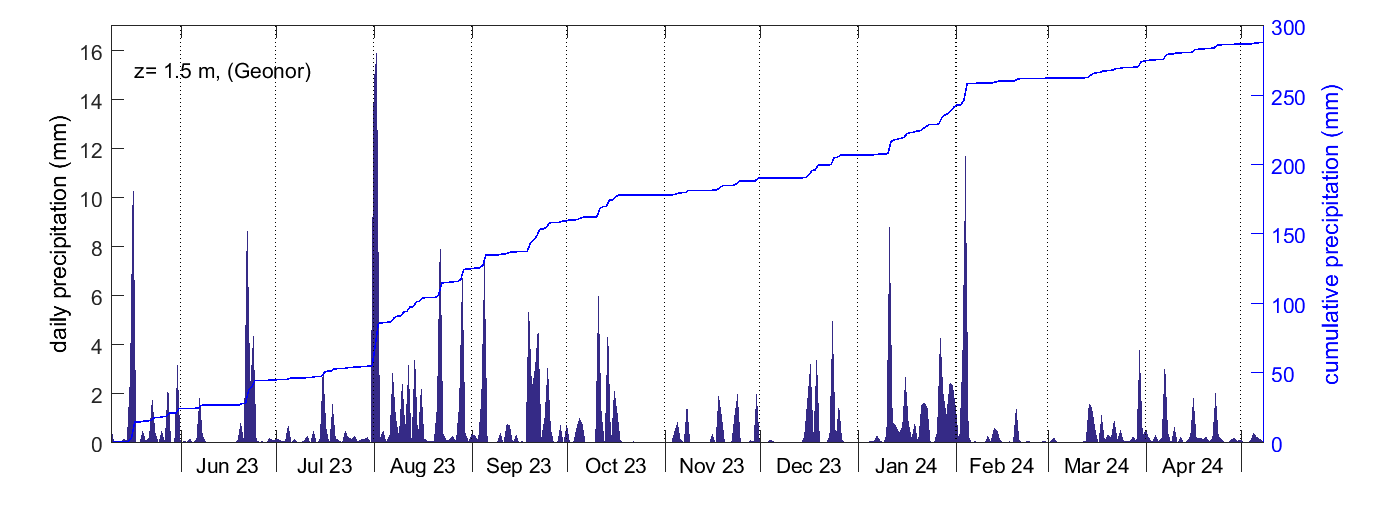
precipitation
relative humidity
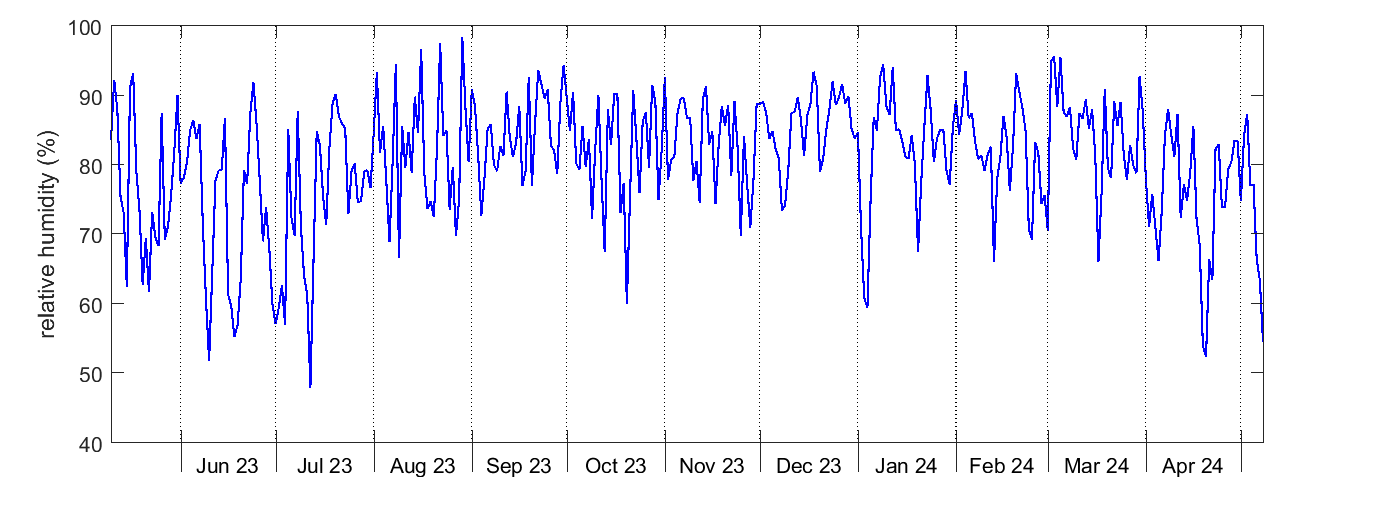
wind speed and direction
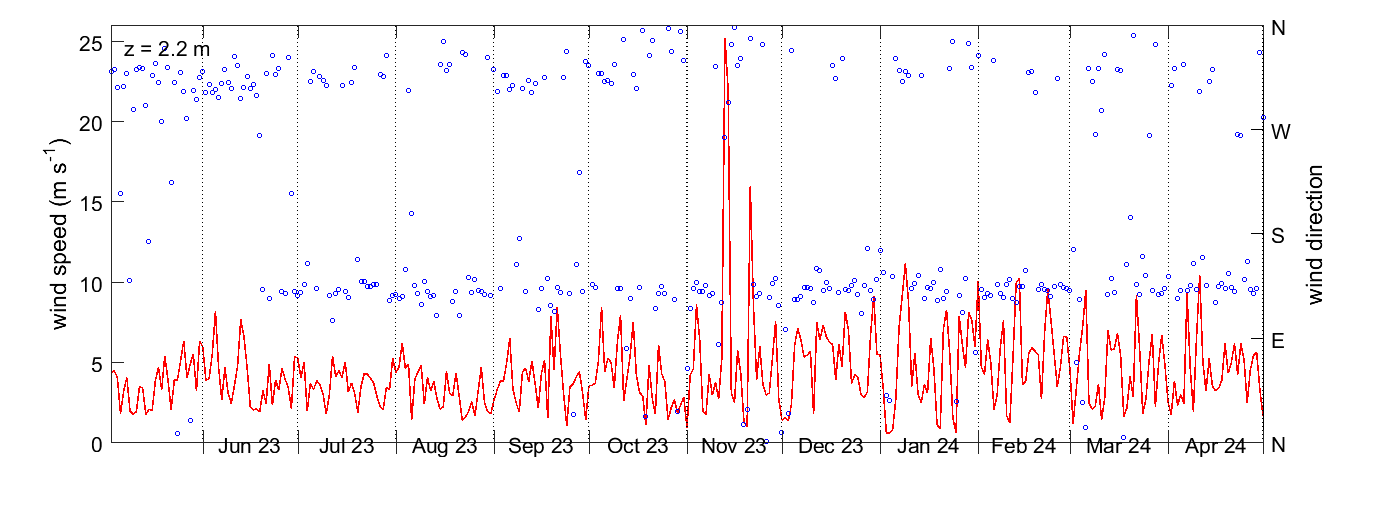
air pressure
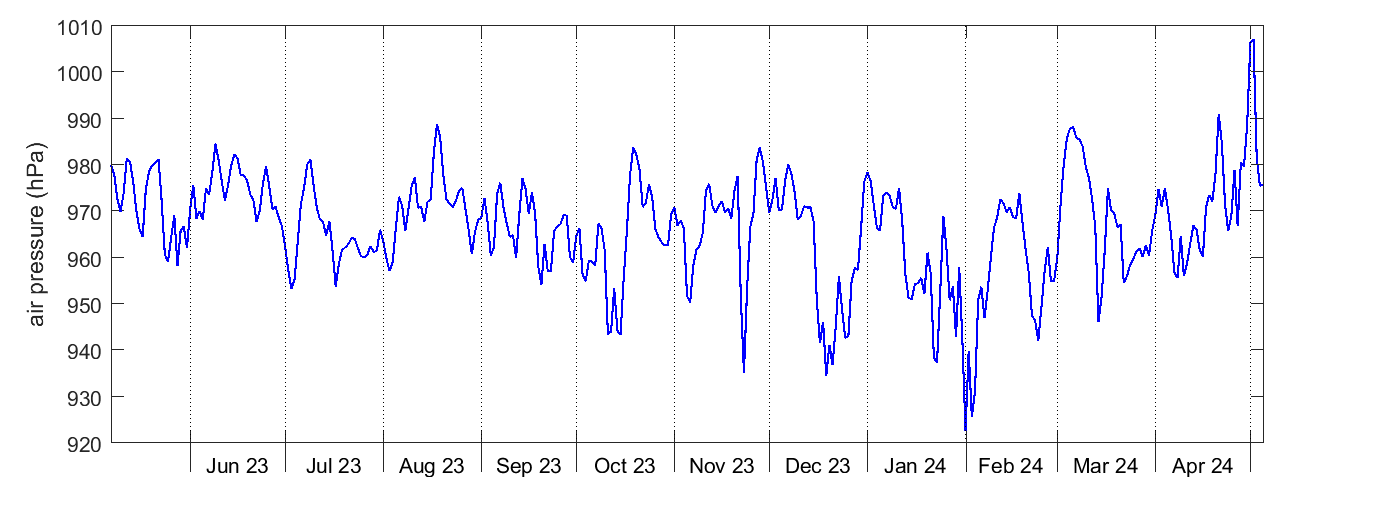
phenocam
Abisko-Stordalen | ||
|
solar radiation
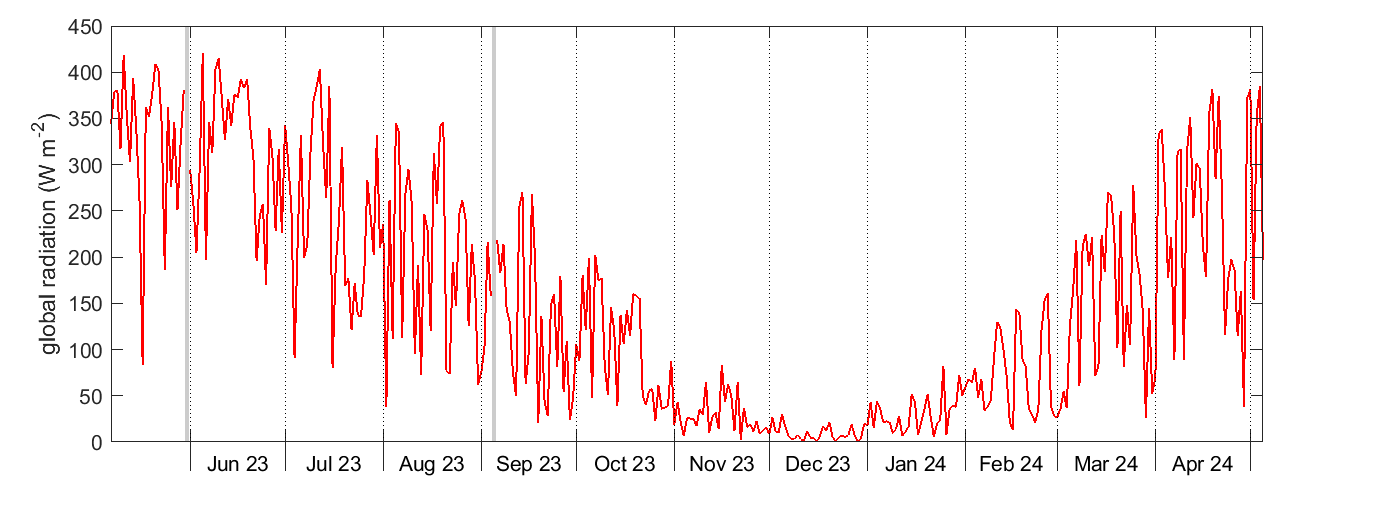
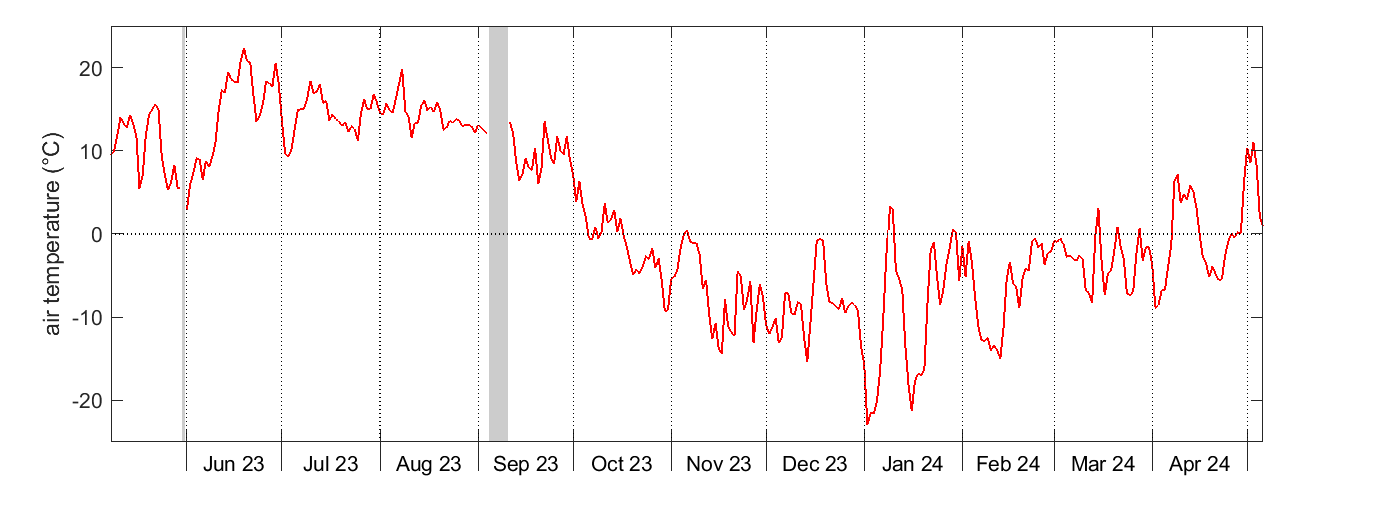
air temperature
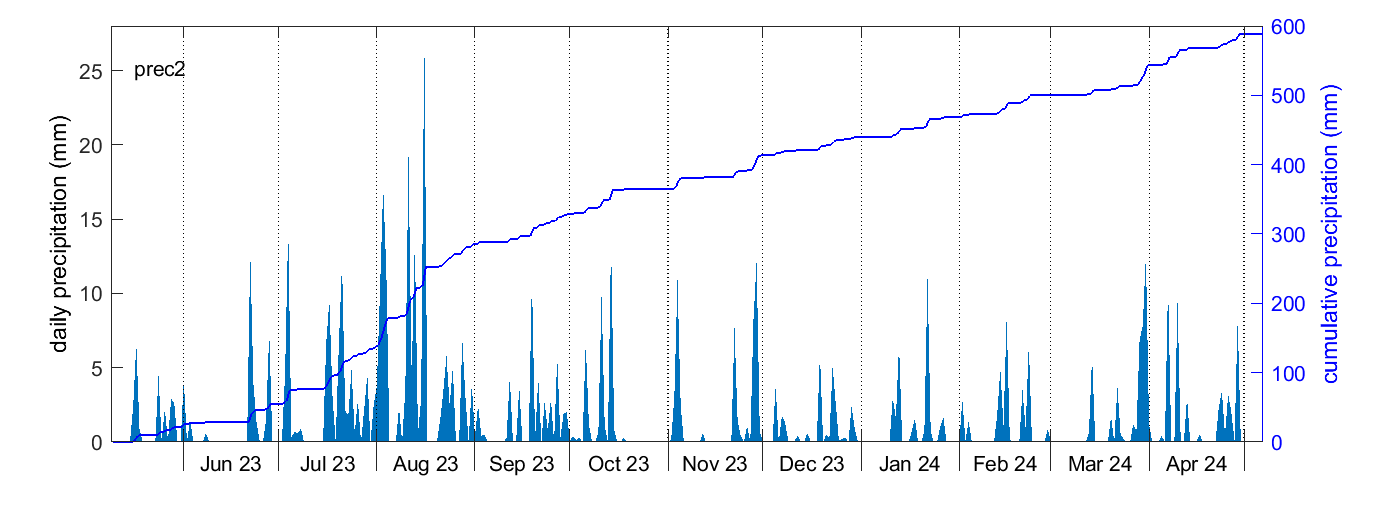
precipitation
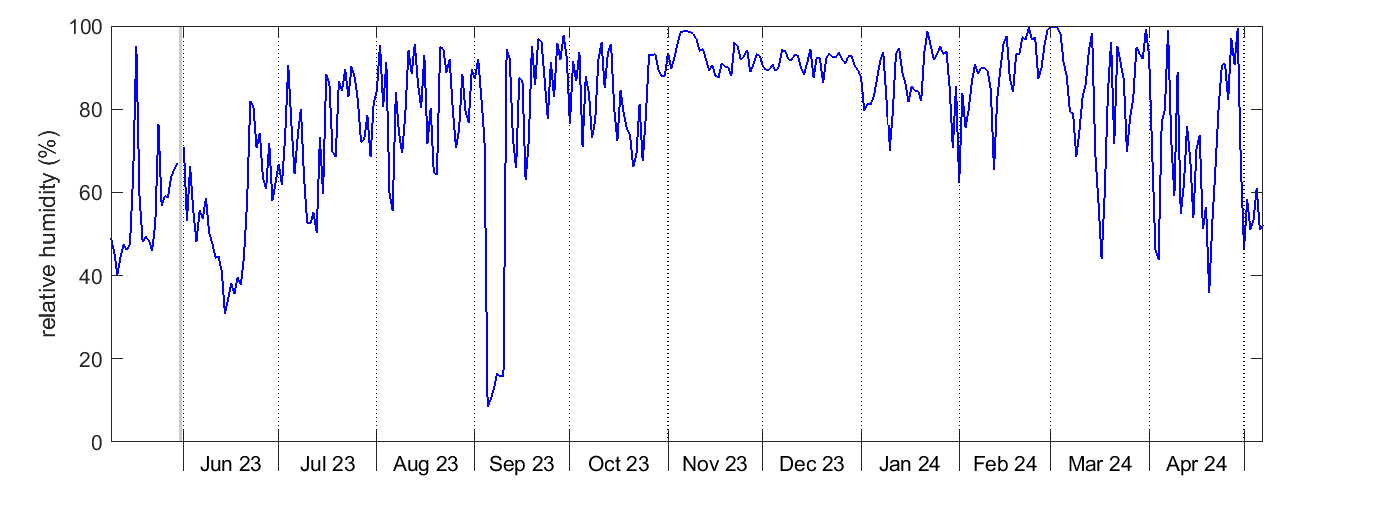
relative humidity
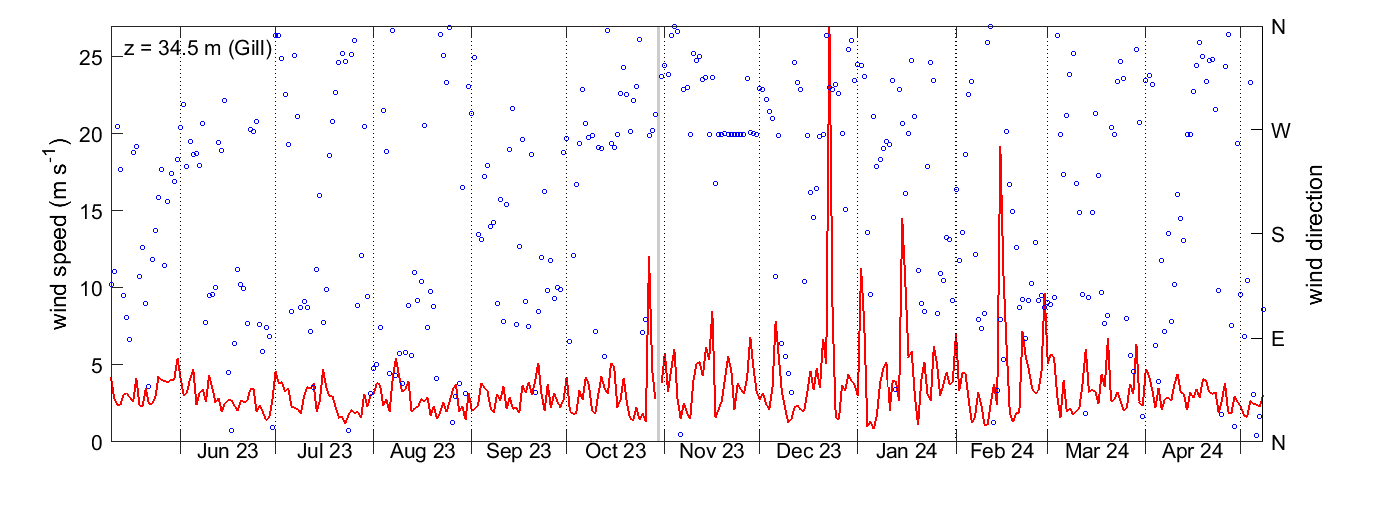
wind speed and direction
air pressure
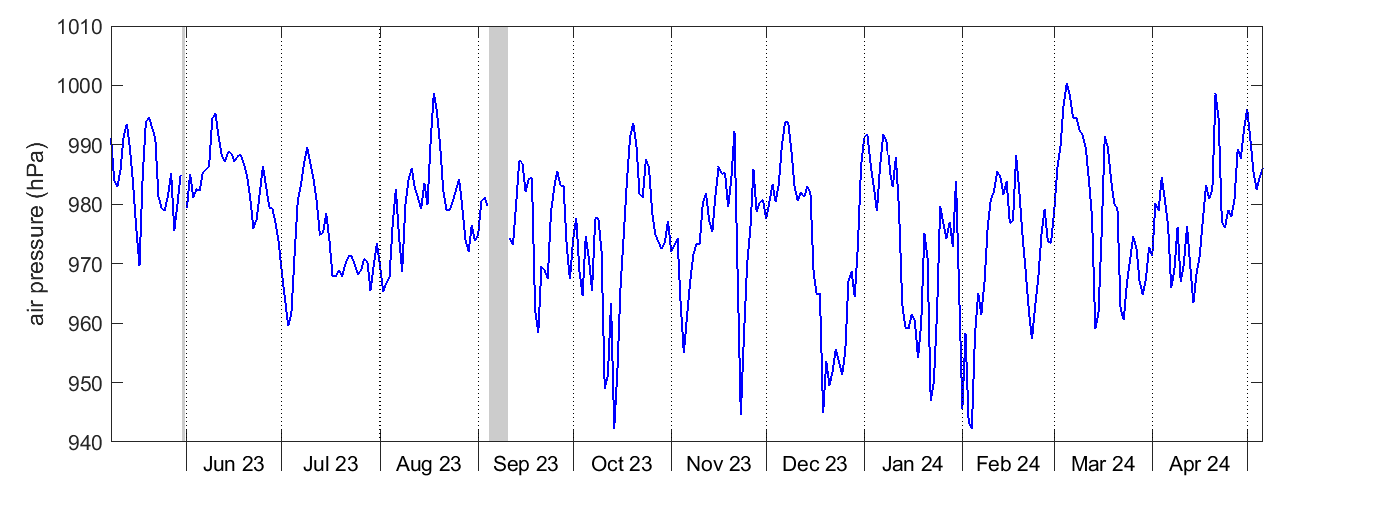
CO2 concentration
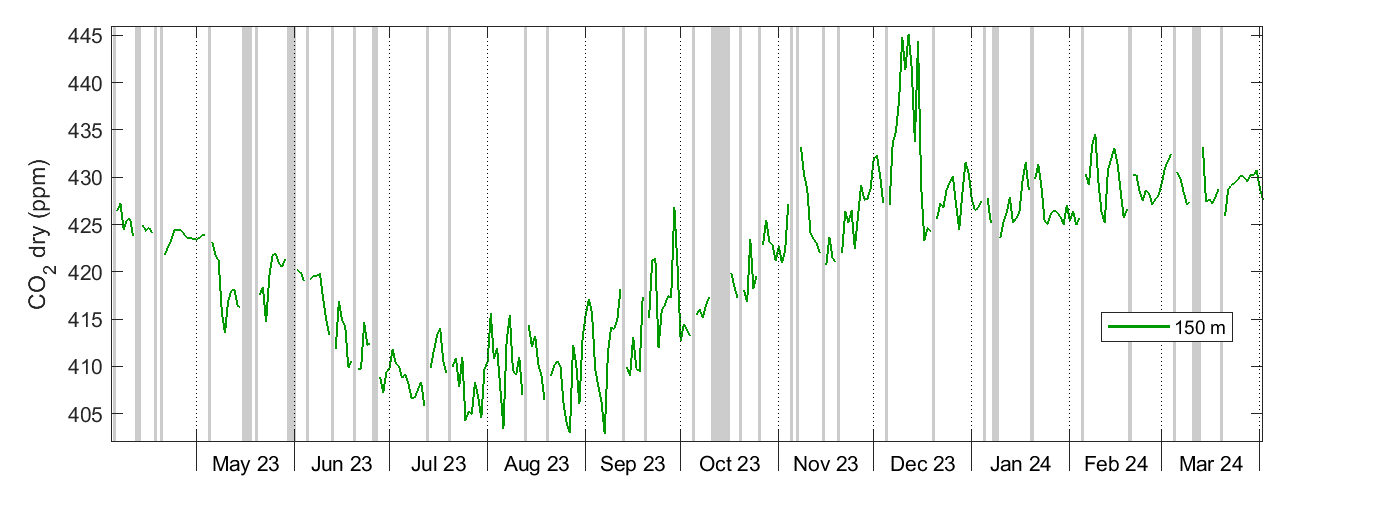
CH4 concentration
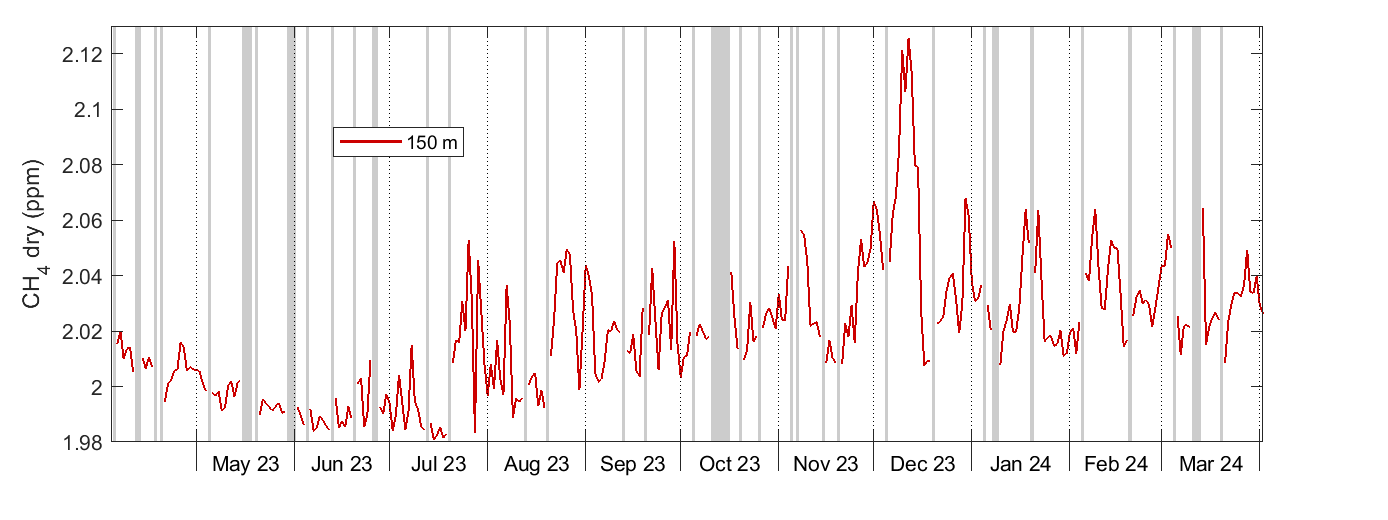
CO concentration
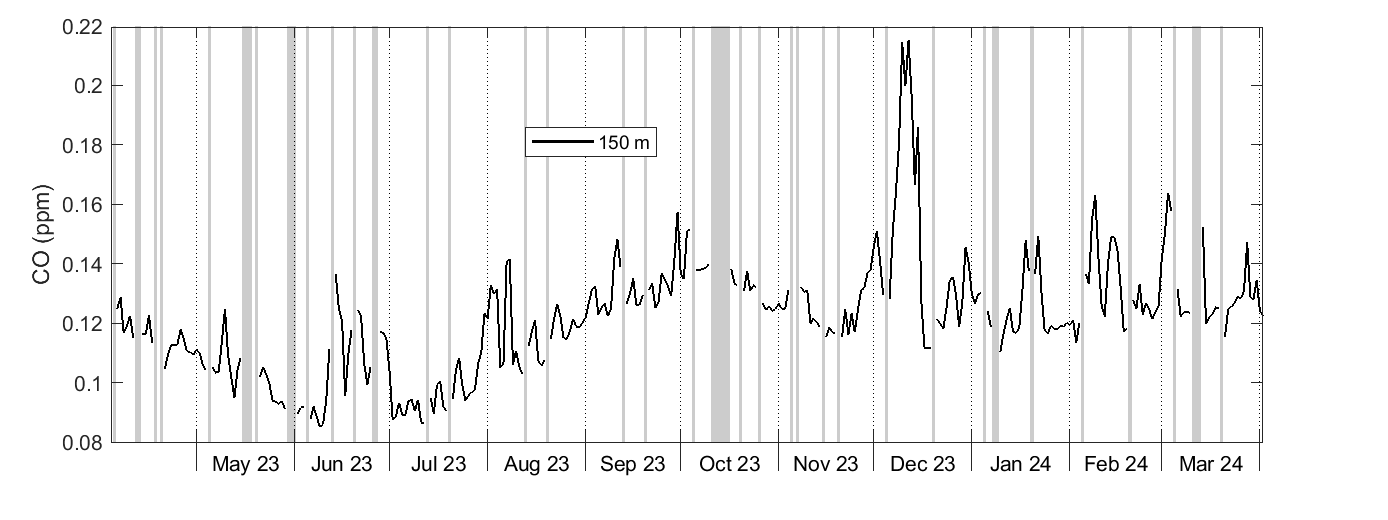
phenocam
Svartberget – Above canopy | Svartberget – Below canopy | |
|
|
solar radiation
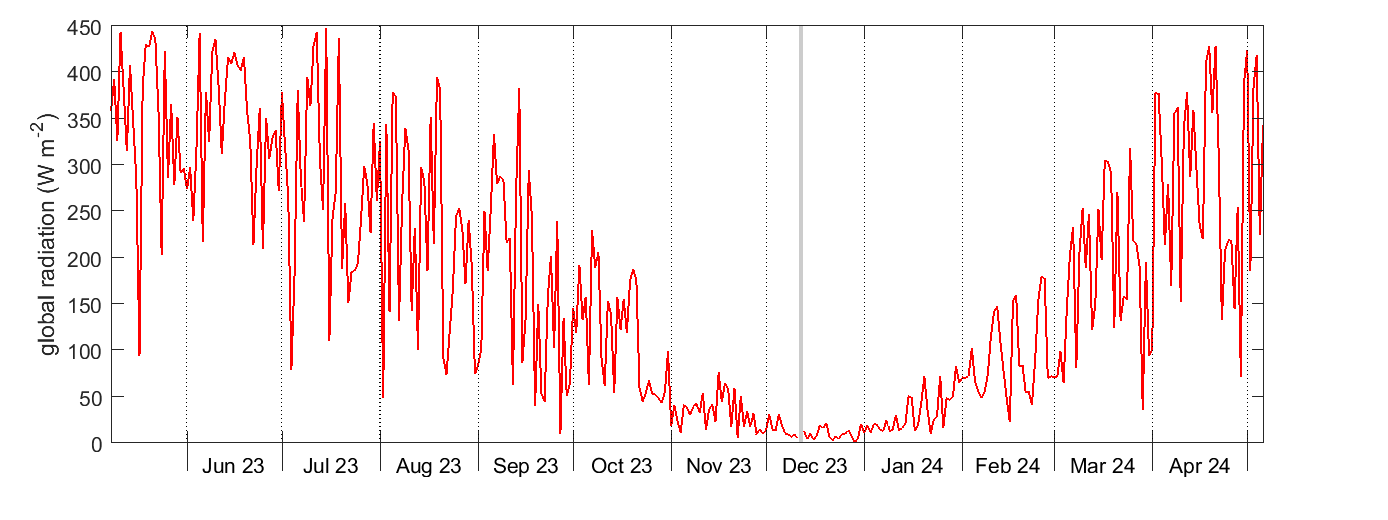
air temperature
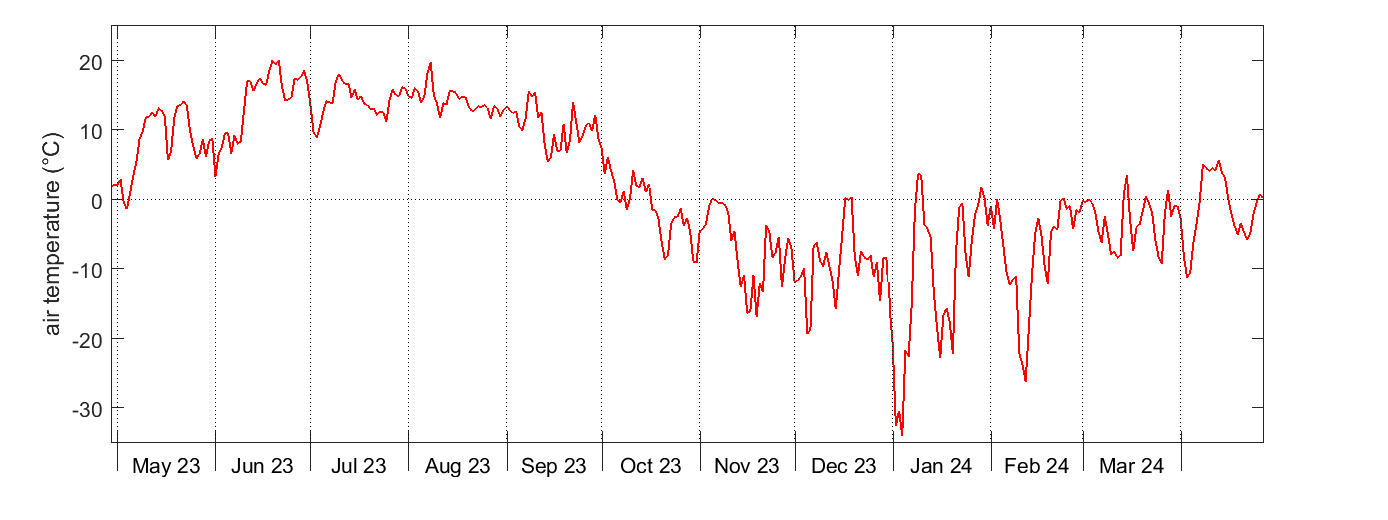
precipitation
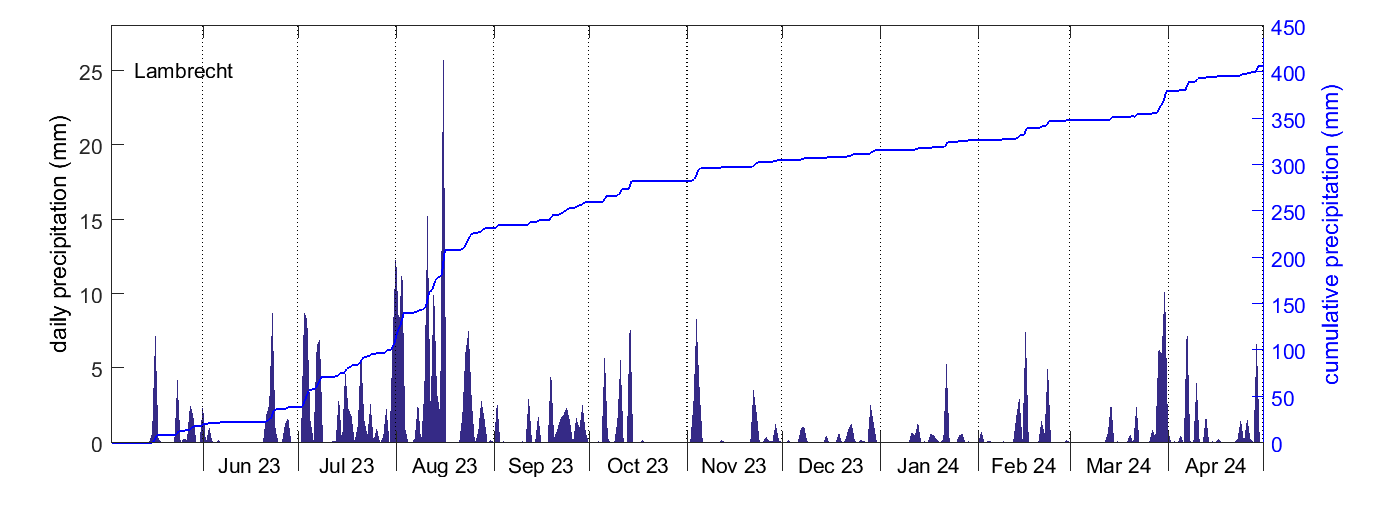
relative humidity
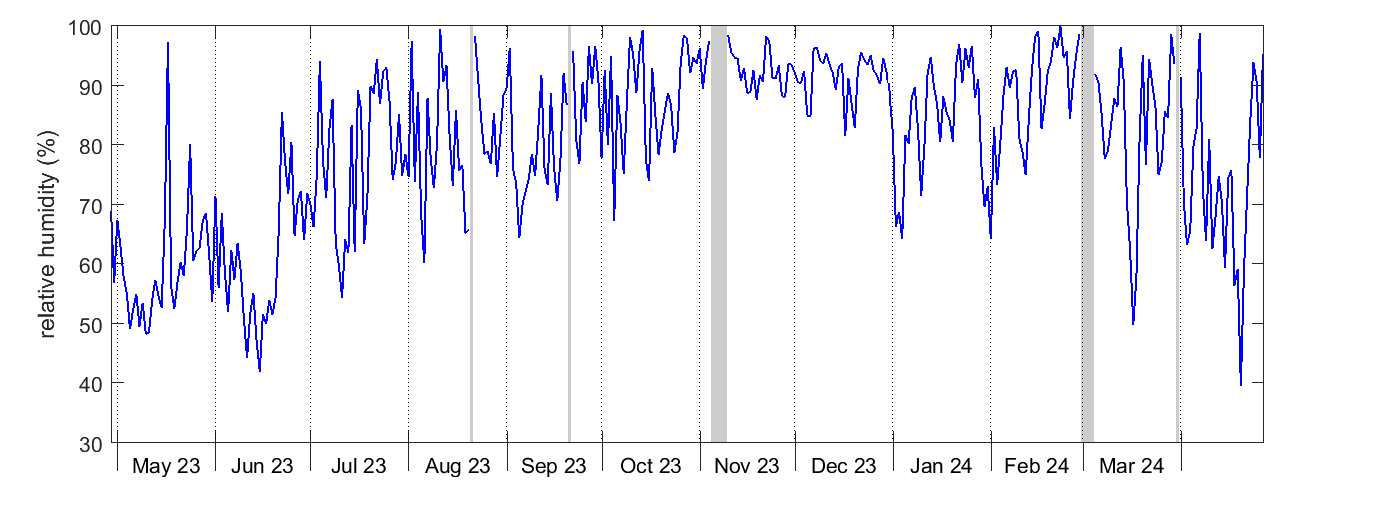
wind speed and direction
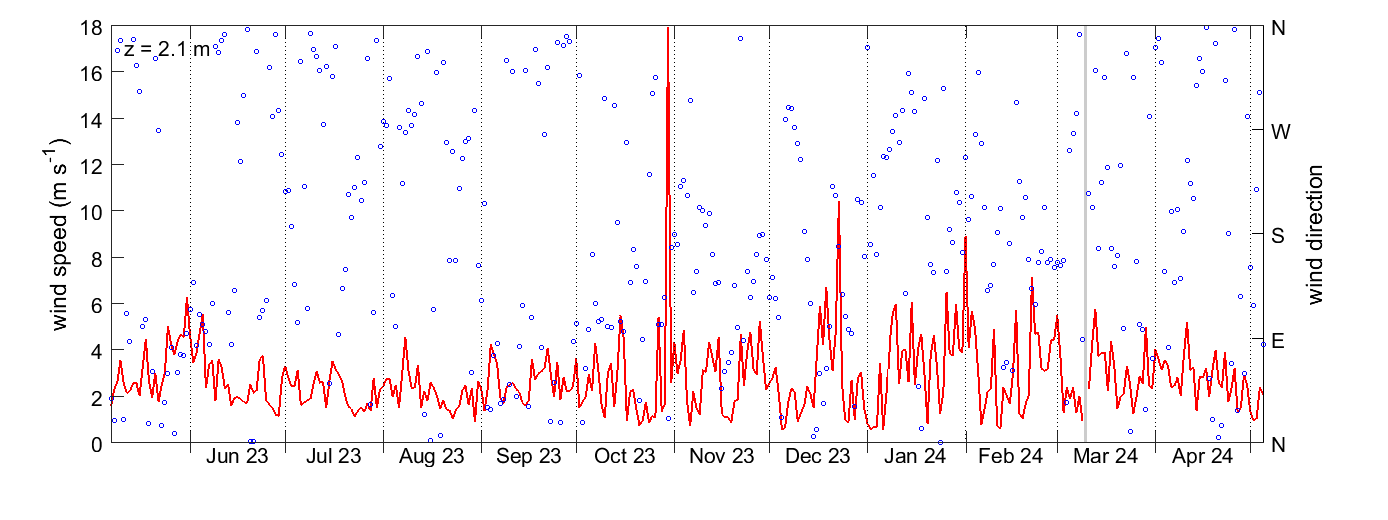
air pressure
currently no graph available
phenocam
Degero | ||
|
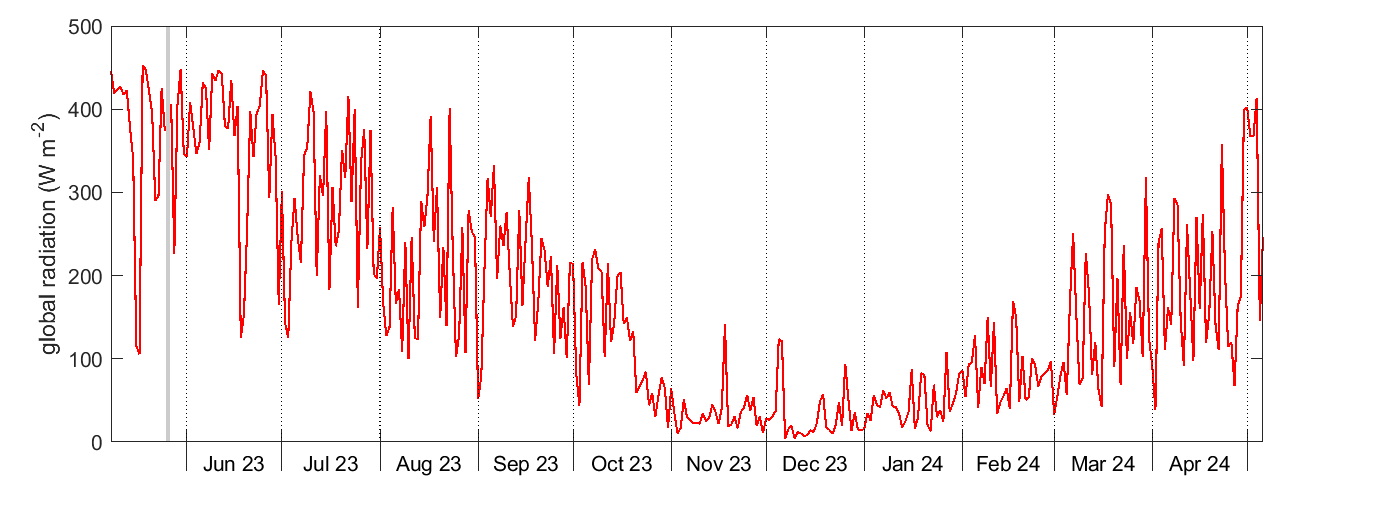
solar radiation
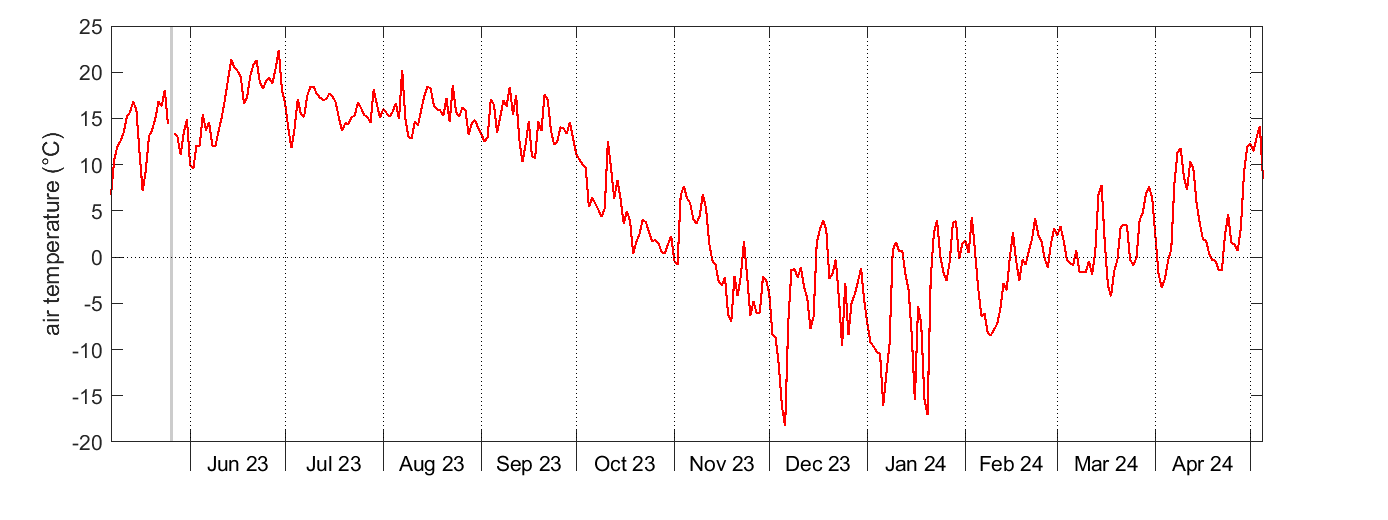
air temperature
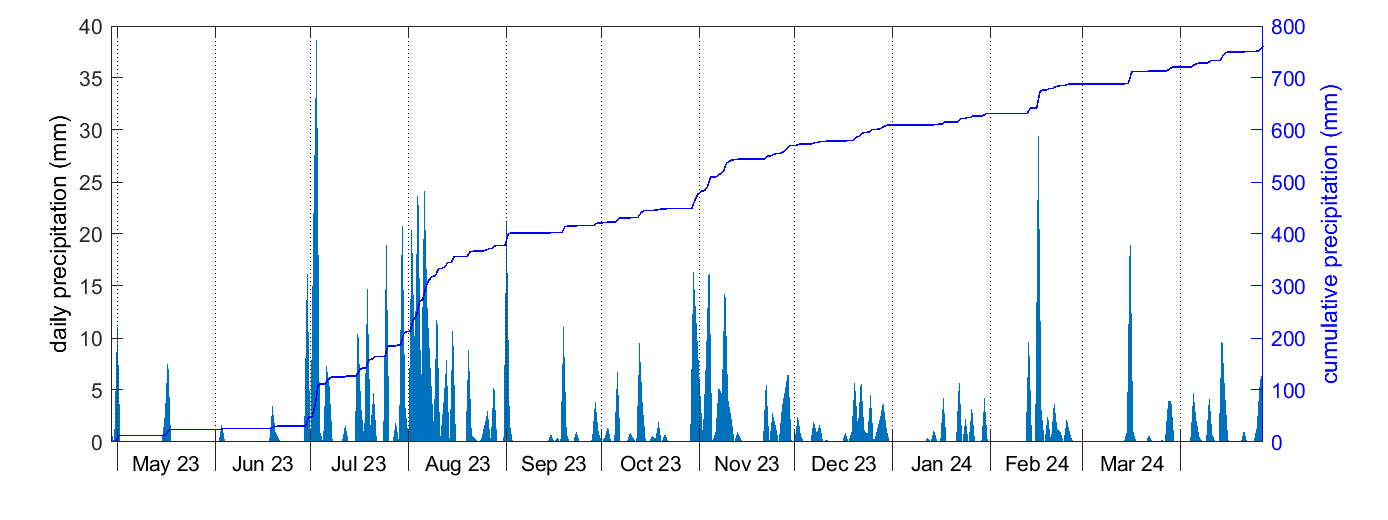
precipitation
relative humidity
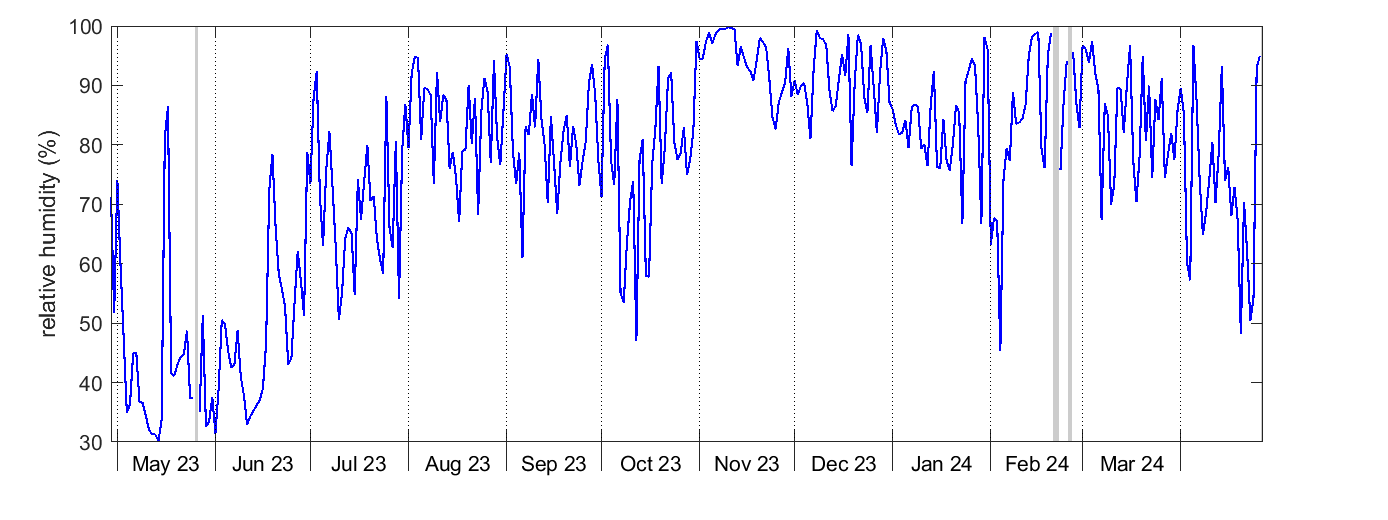
wind speed and direction
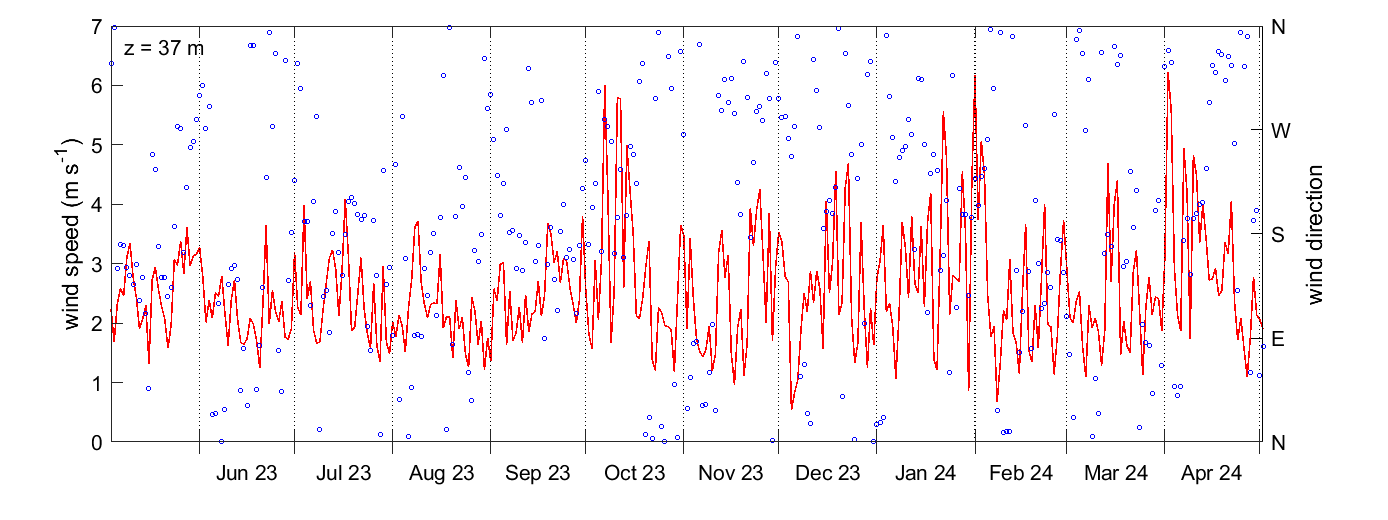
air pressure
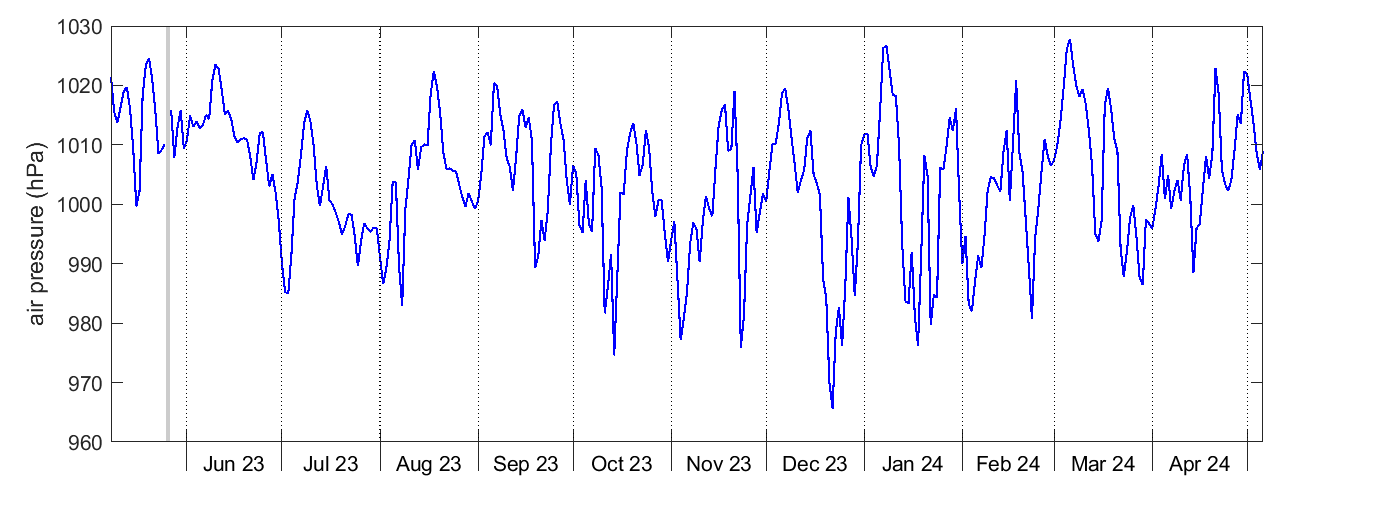
CO2 concentration
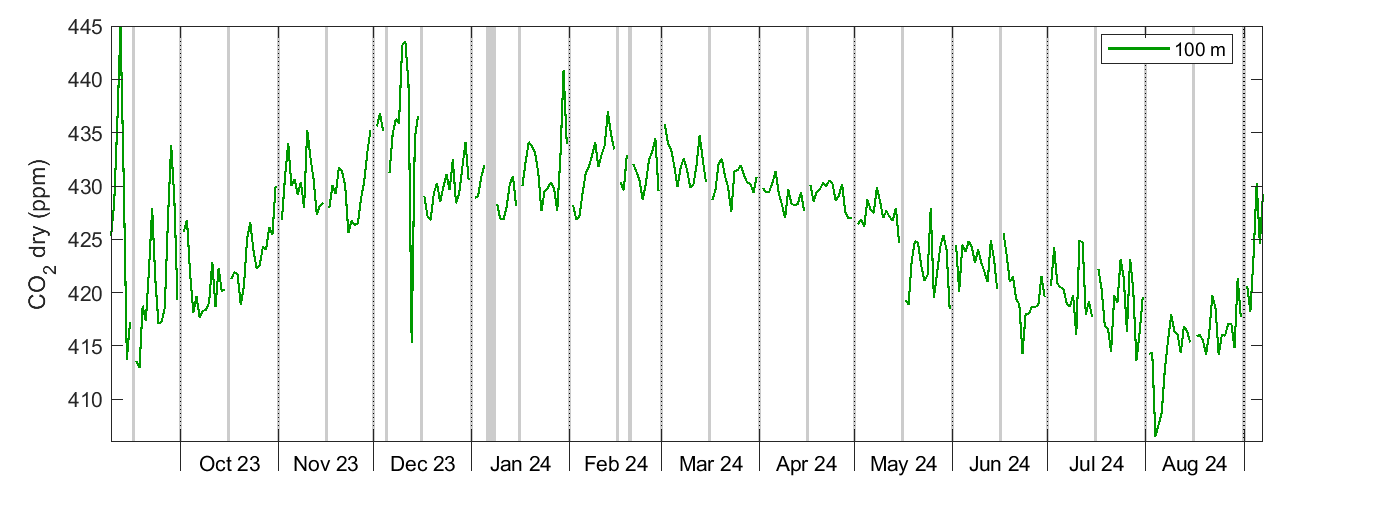
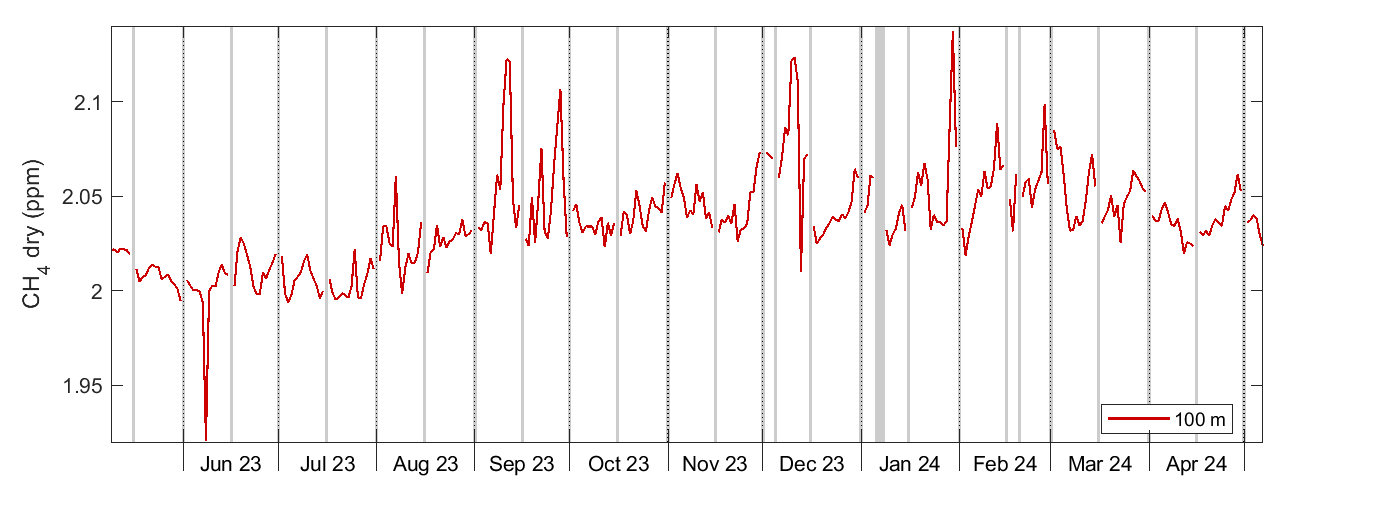
CH4 concentration
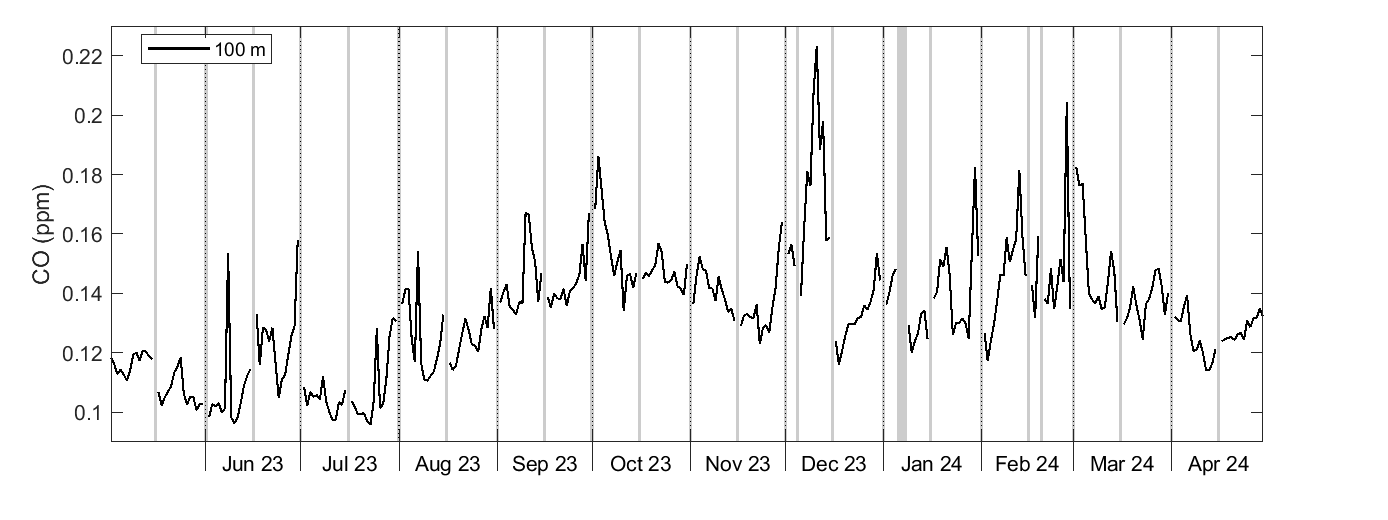
CO concentration
phenocam
Norunda – upper cam | Norunda – lower cam | |
|
|
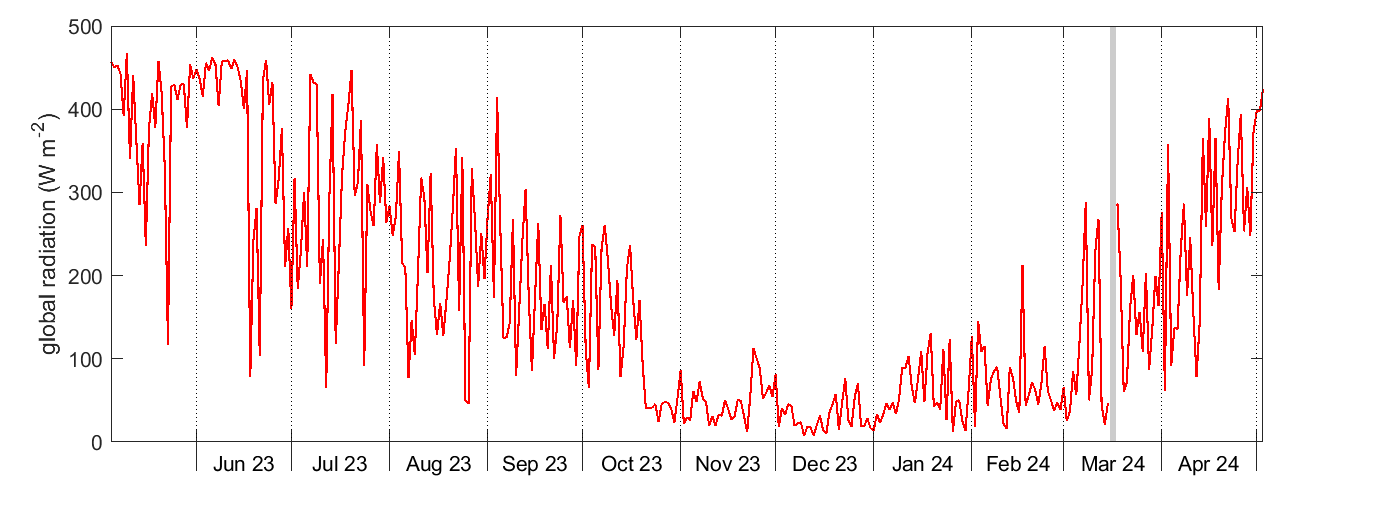
solar radiation
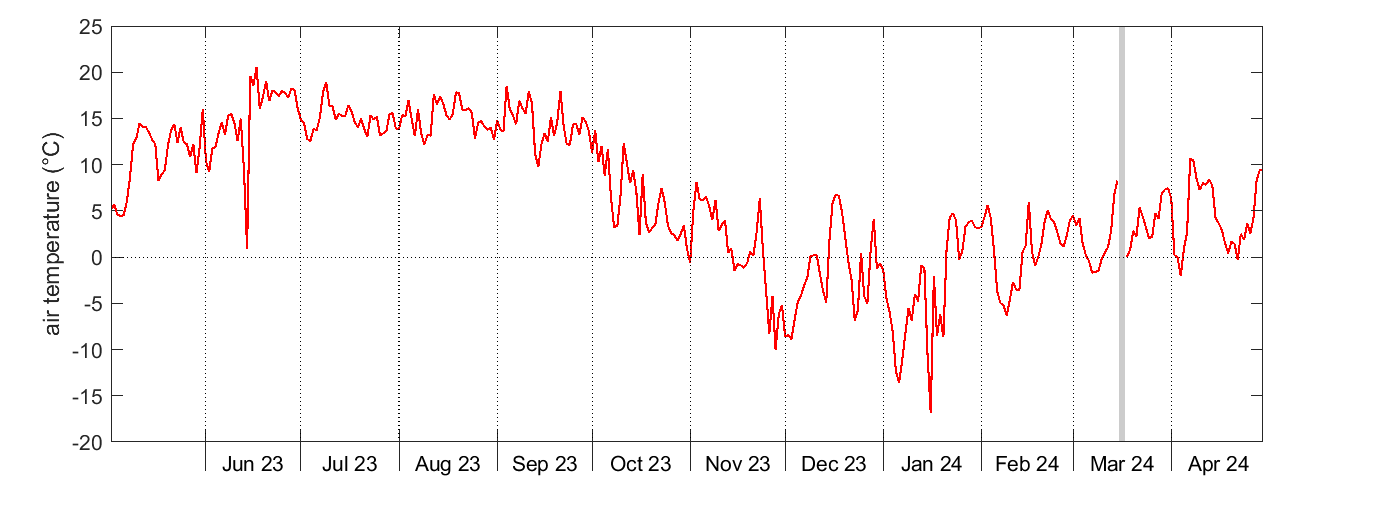
air temperature
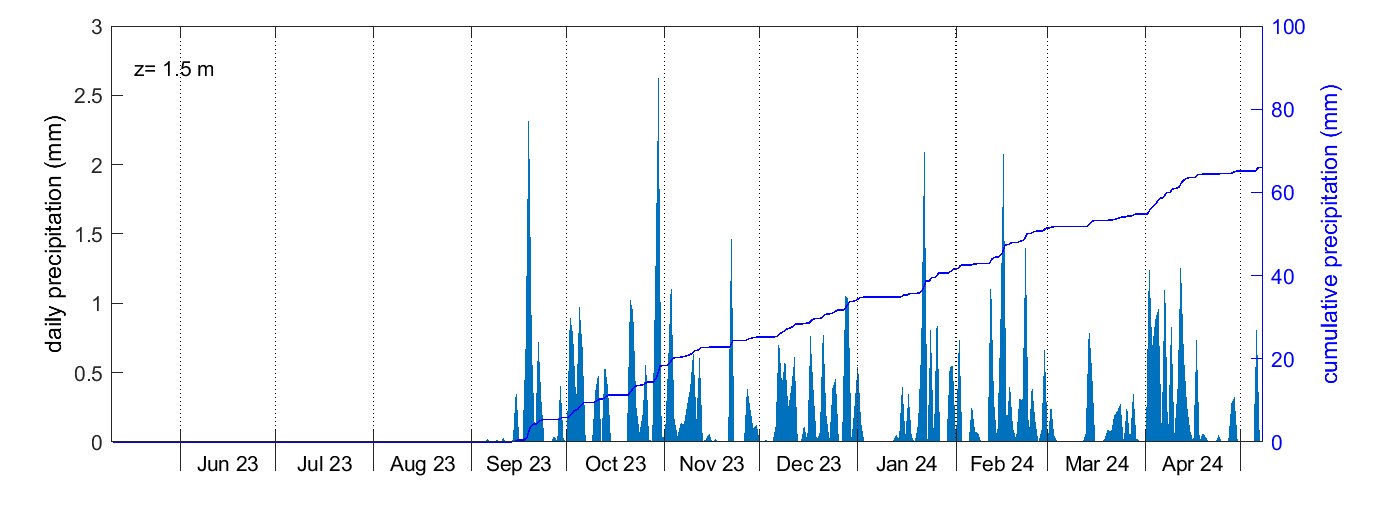
precipitation
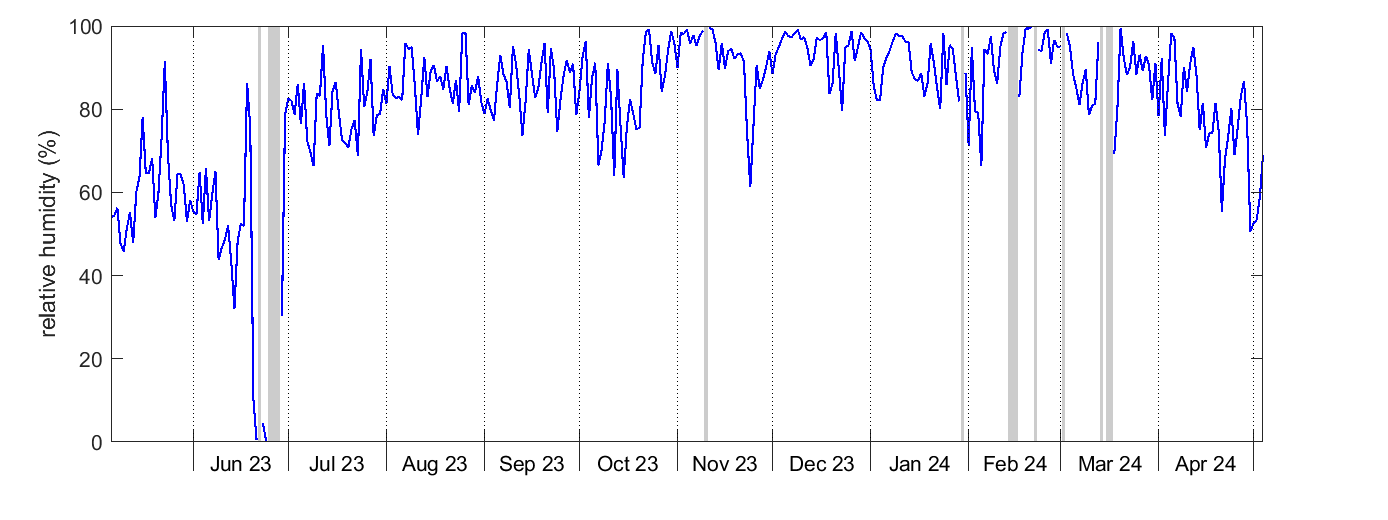
relative humidity
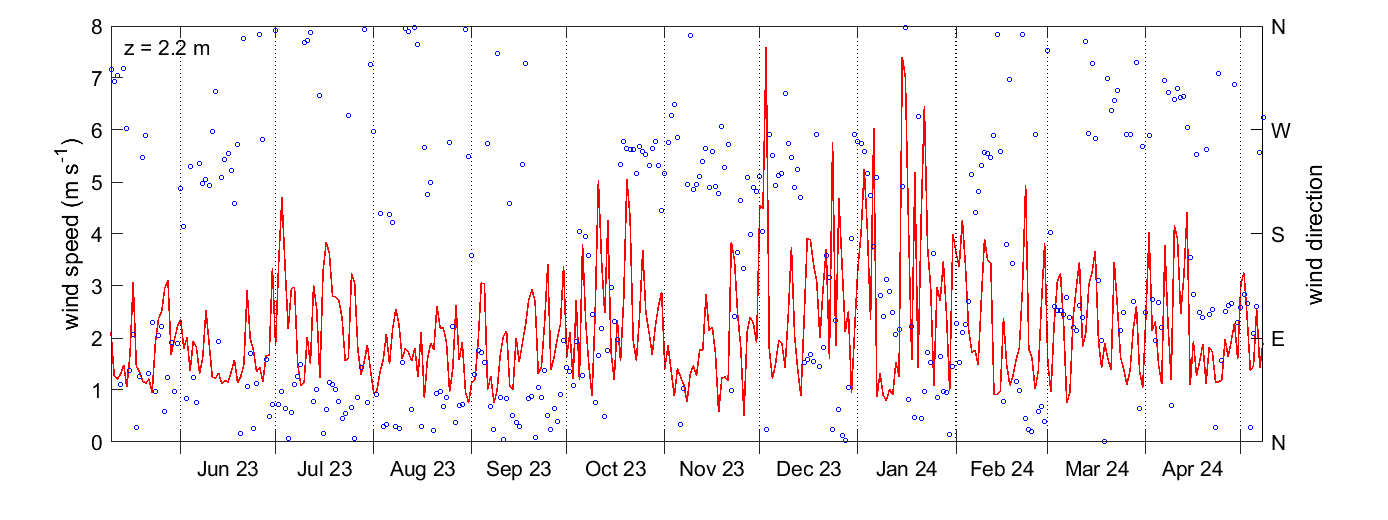
wind speed and direction
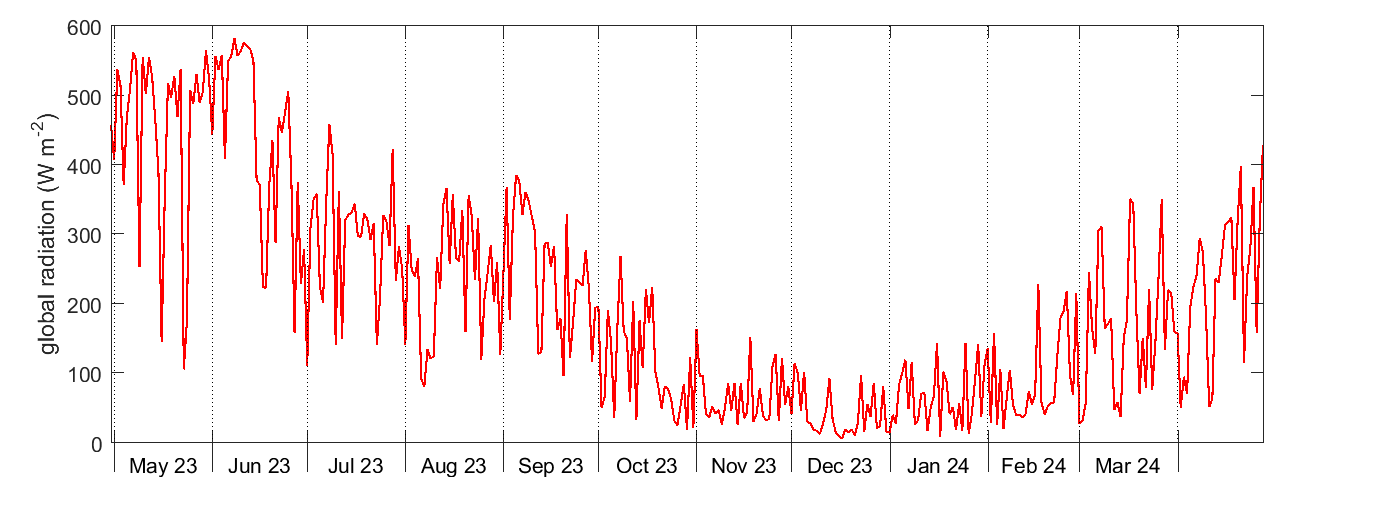
solar radiation
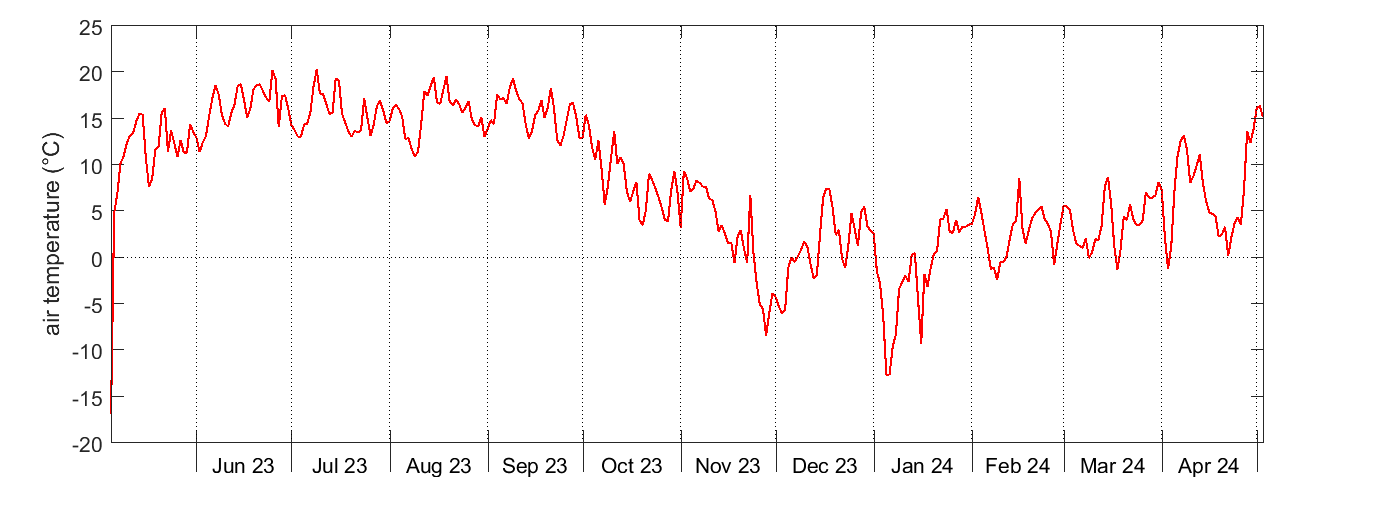
air temperature
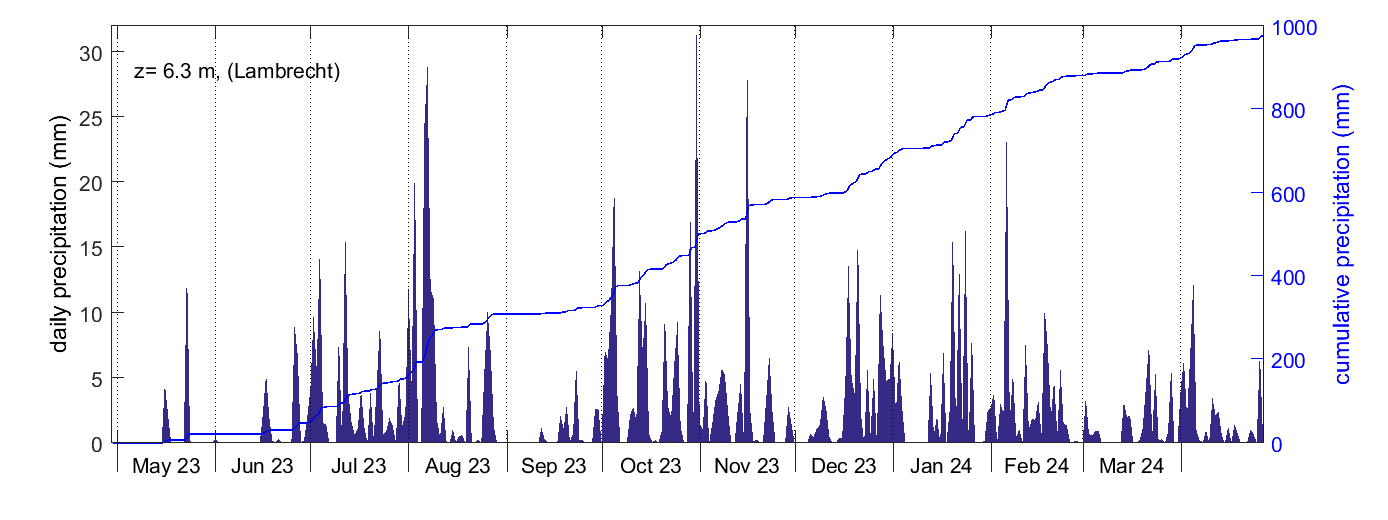
precipitation
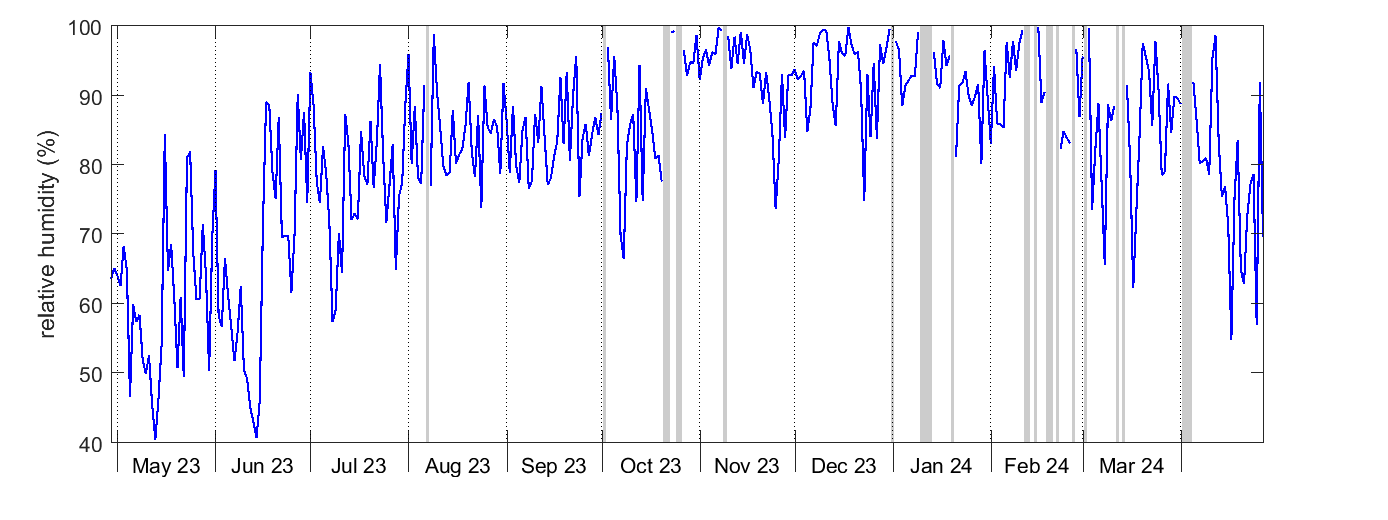
relative humidity
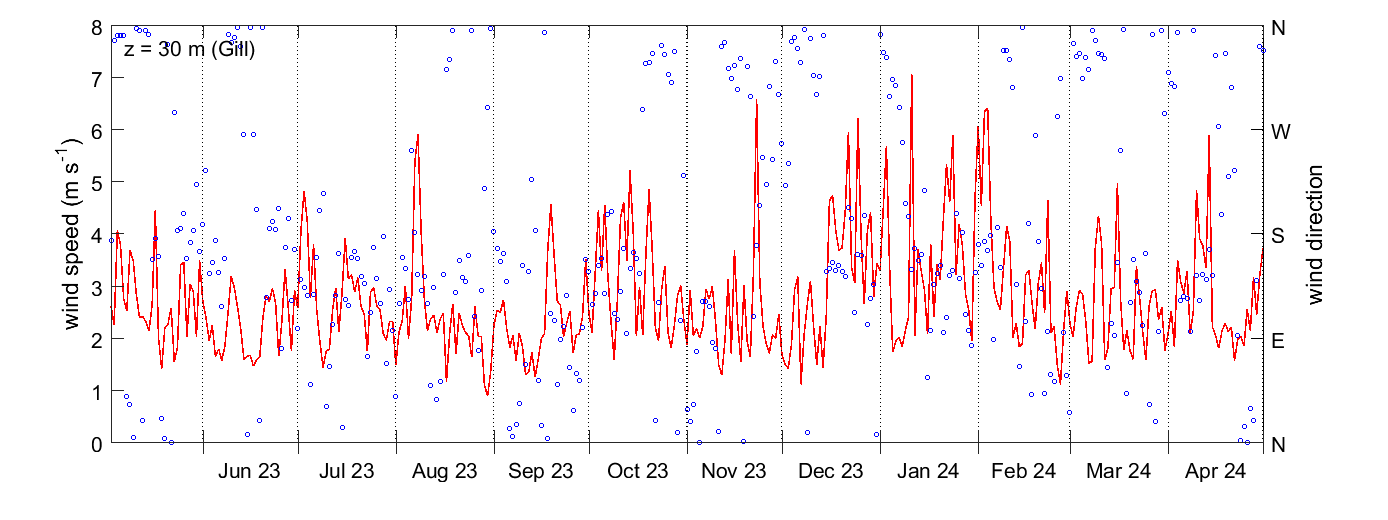
wind speed and direction
air pressure
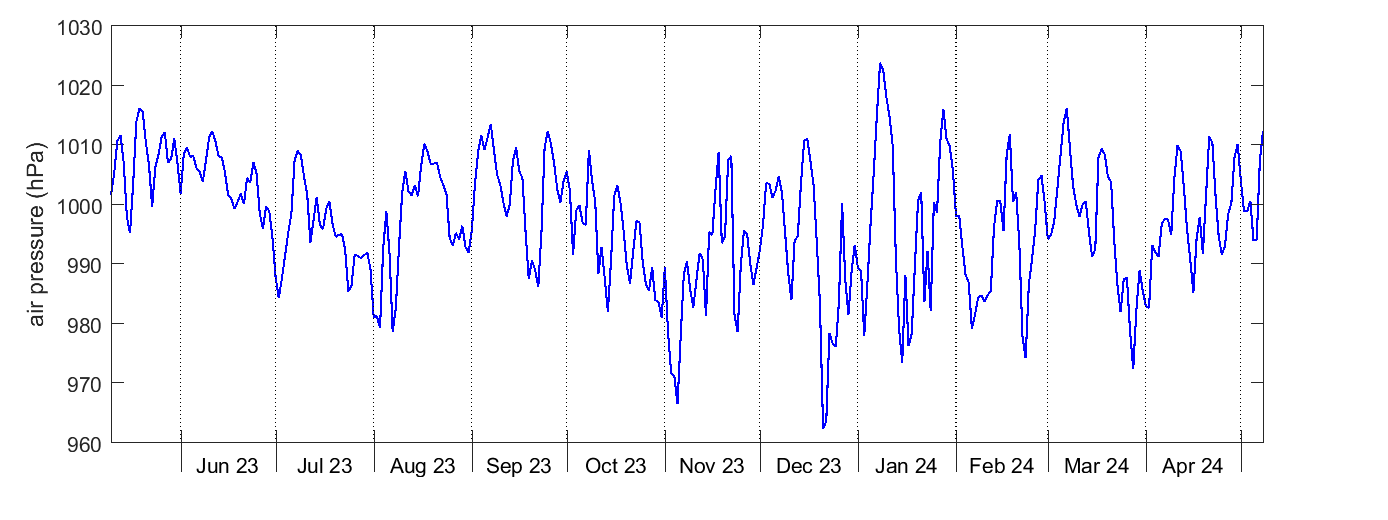
CO2 concentration
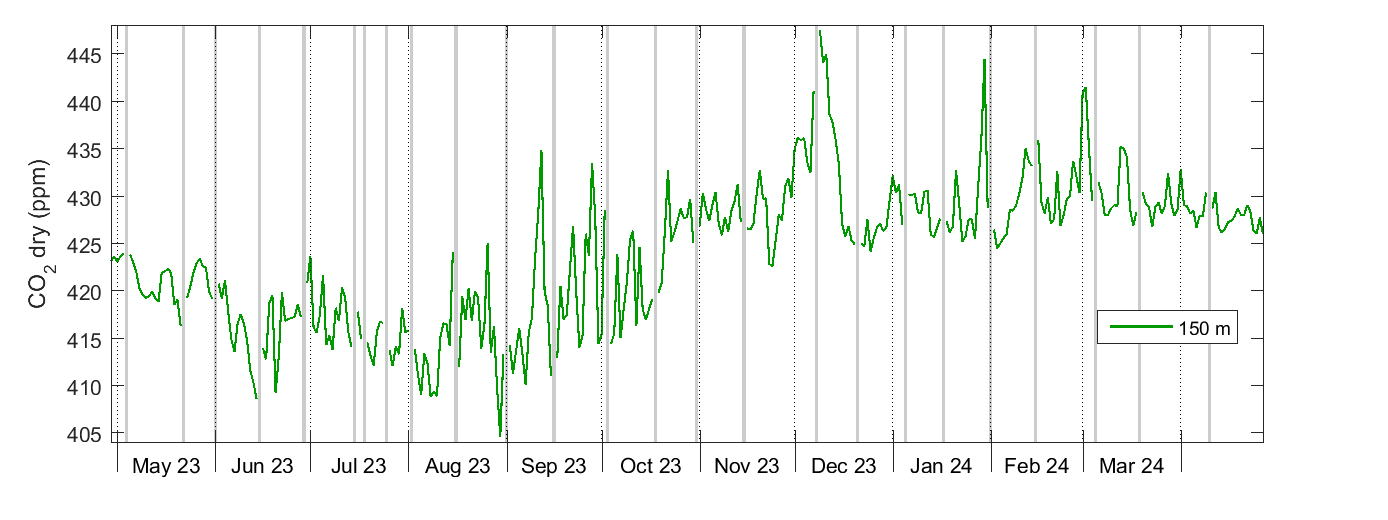
CH4 concentration
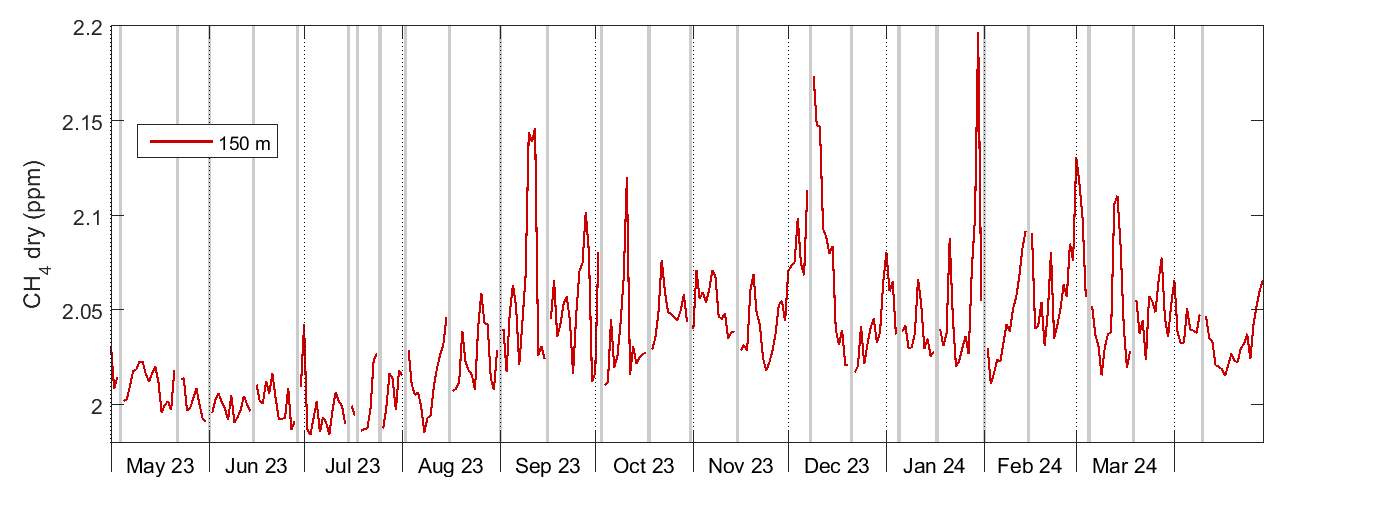
CO concentration
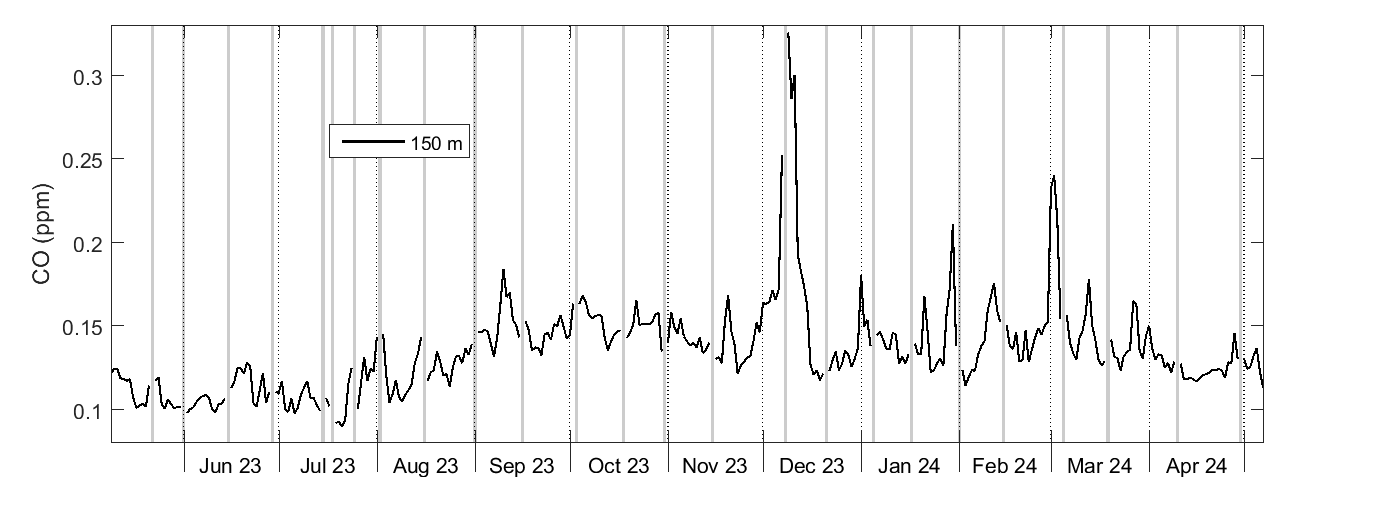
ground water level
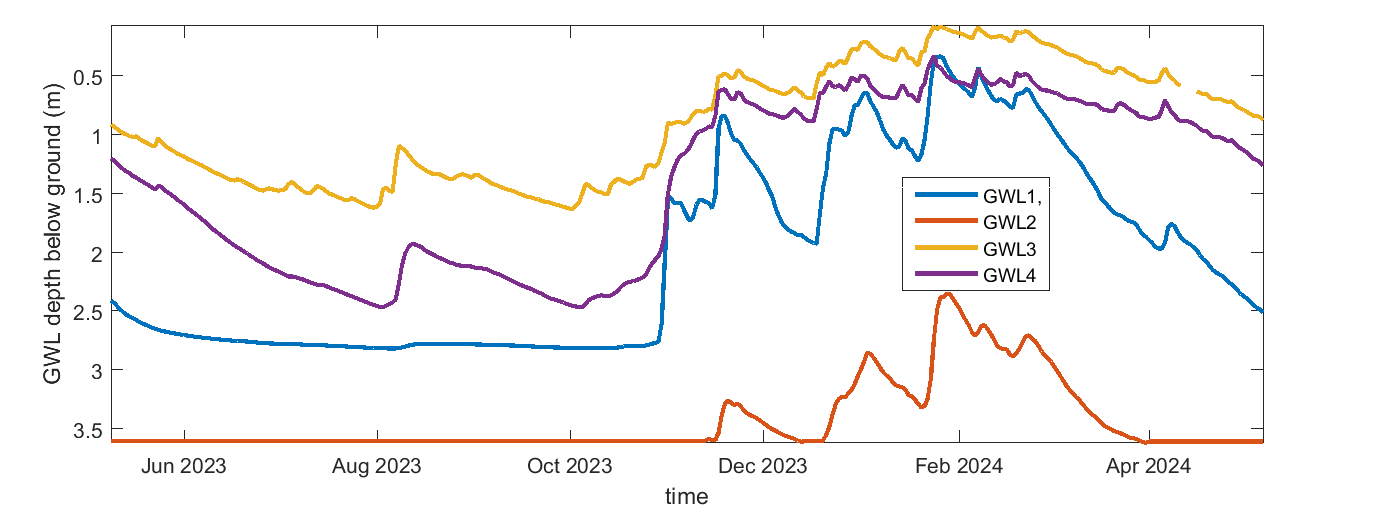
phenocam
Hyltemossa – Above canopy | Hyltemossa – Below canopy | |
|
|
air temperature
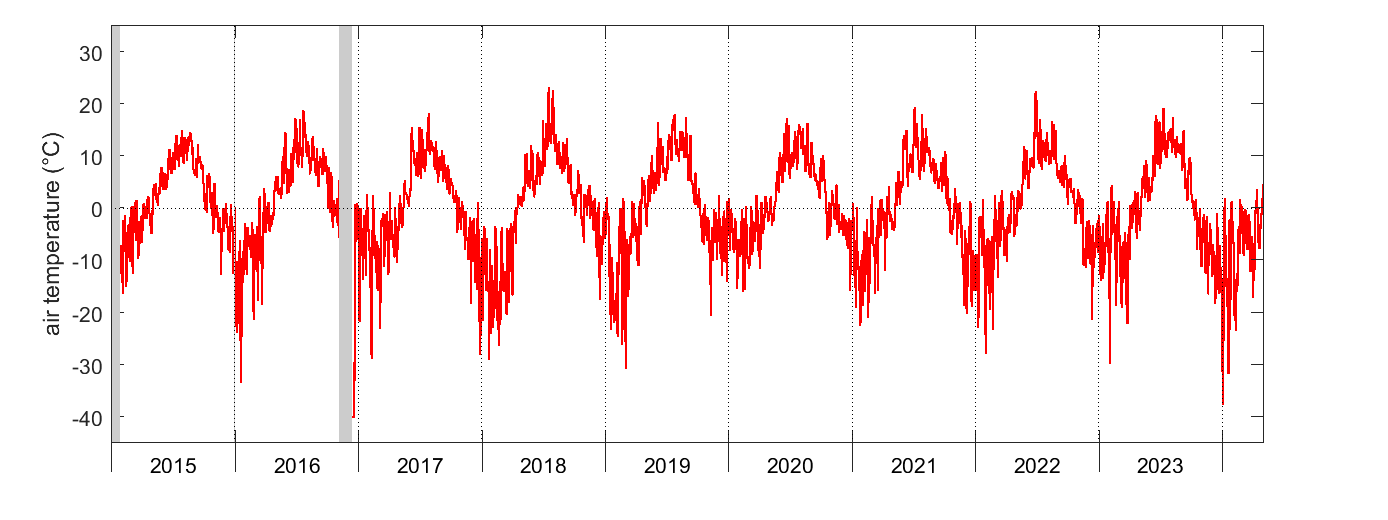
air temperature
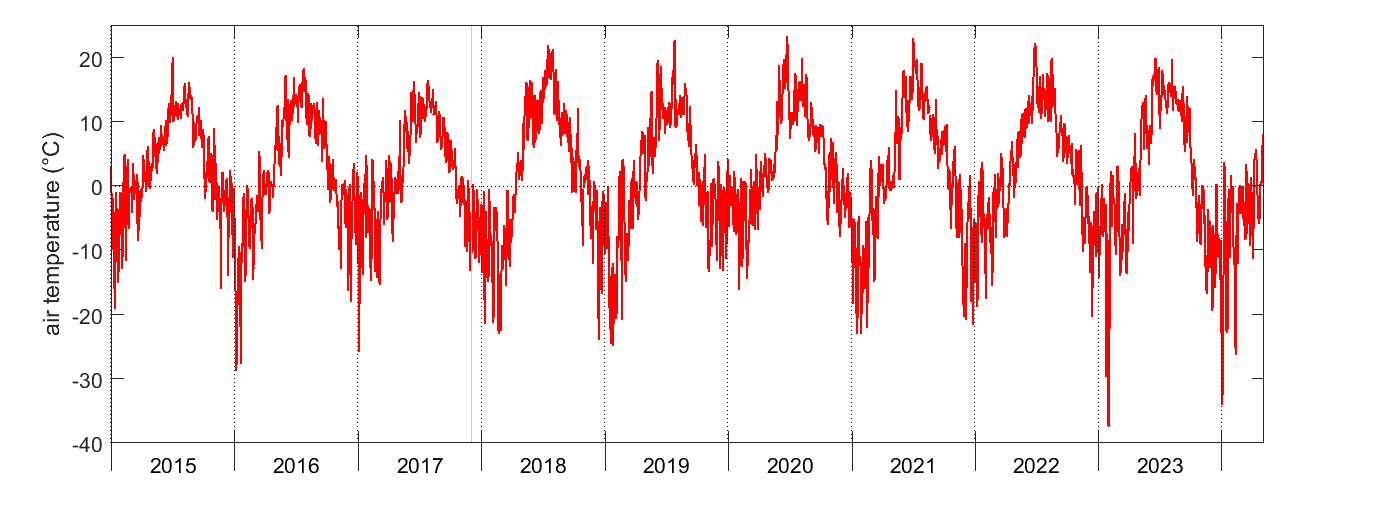
CO2 concentration
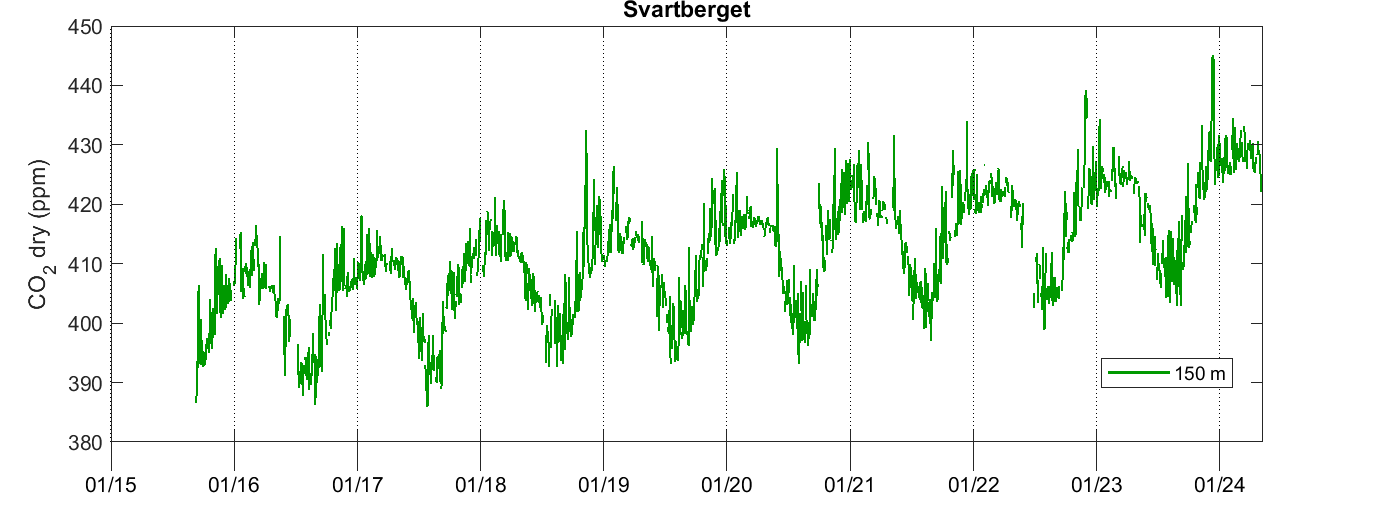
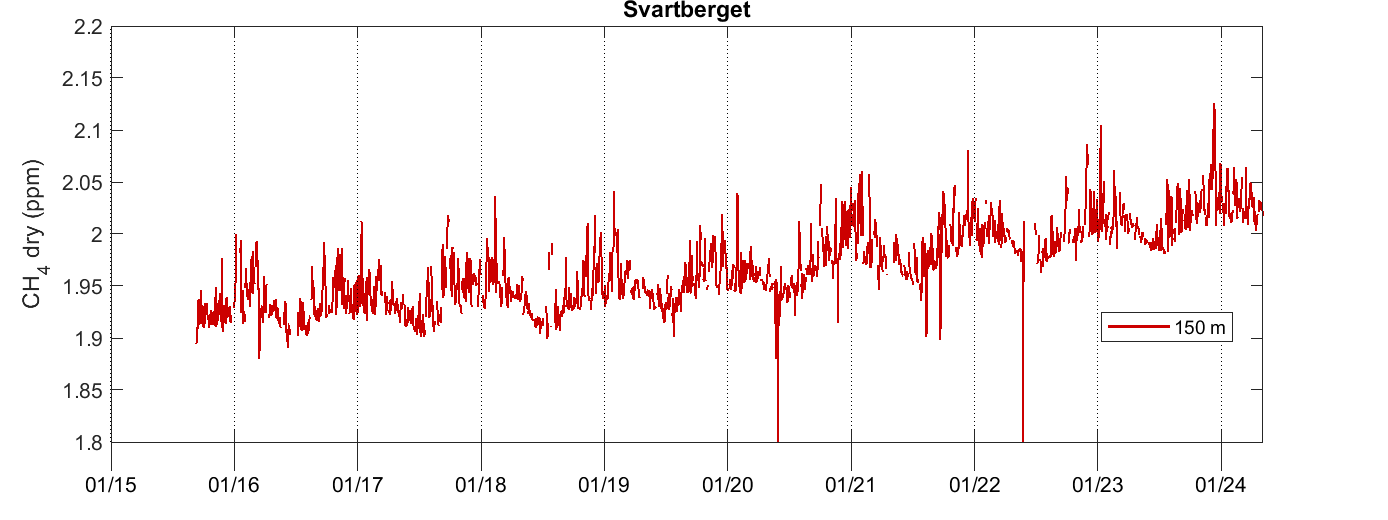
CH4 concentration
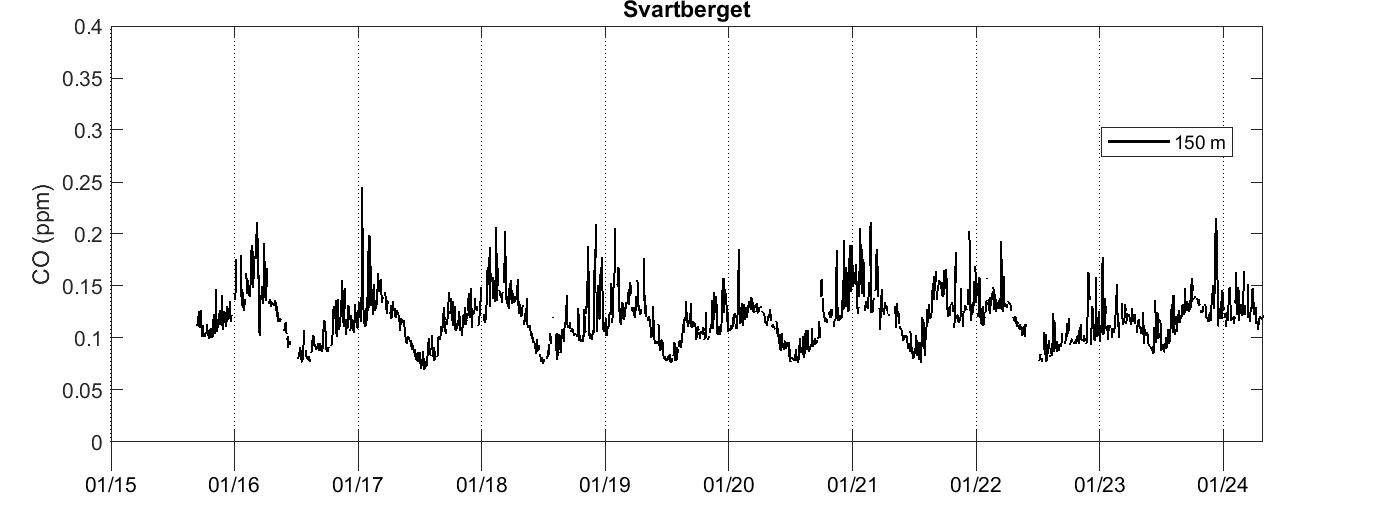
CO concentration
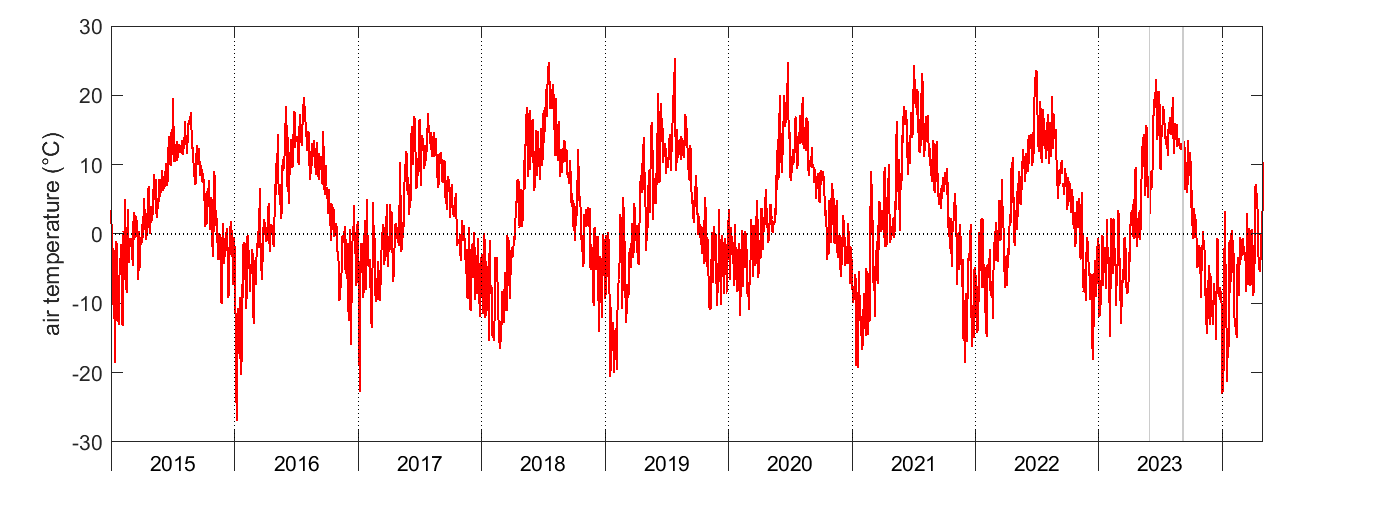
air temperature
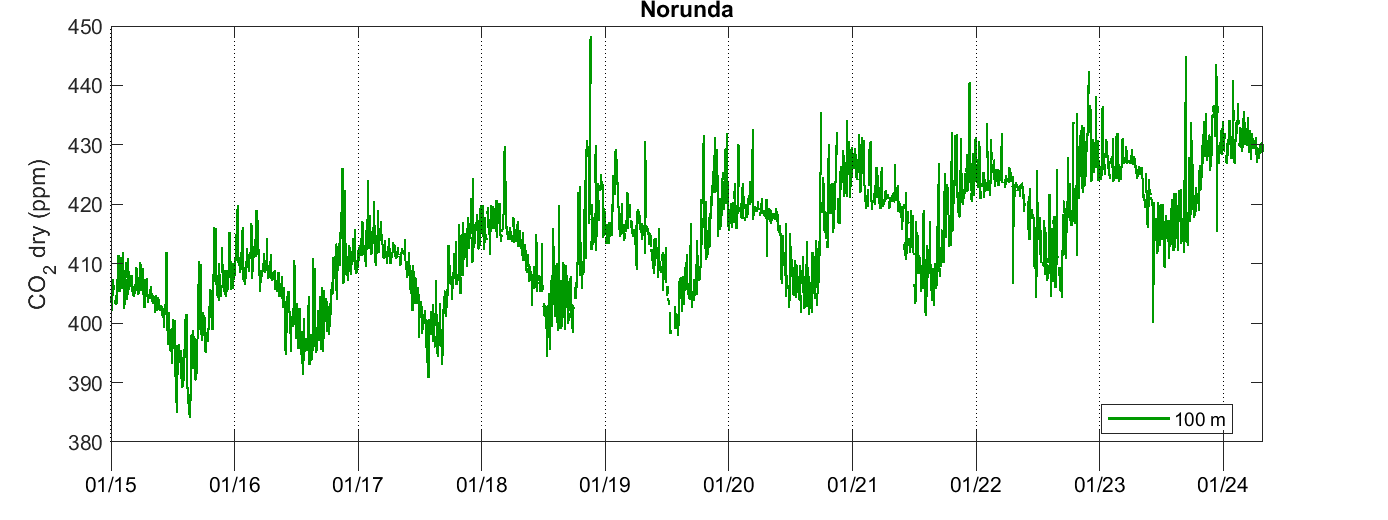
CO2 concentration
CH4 concentration
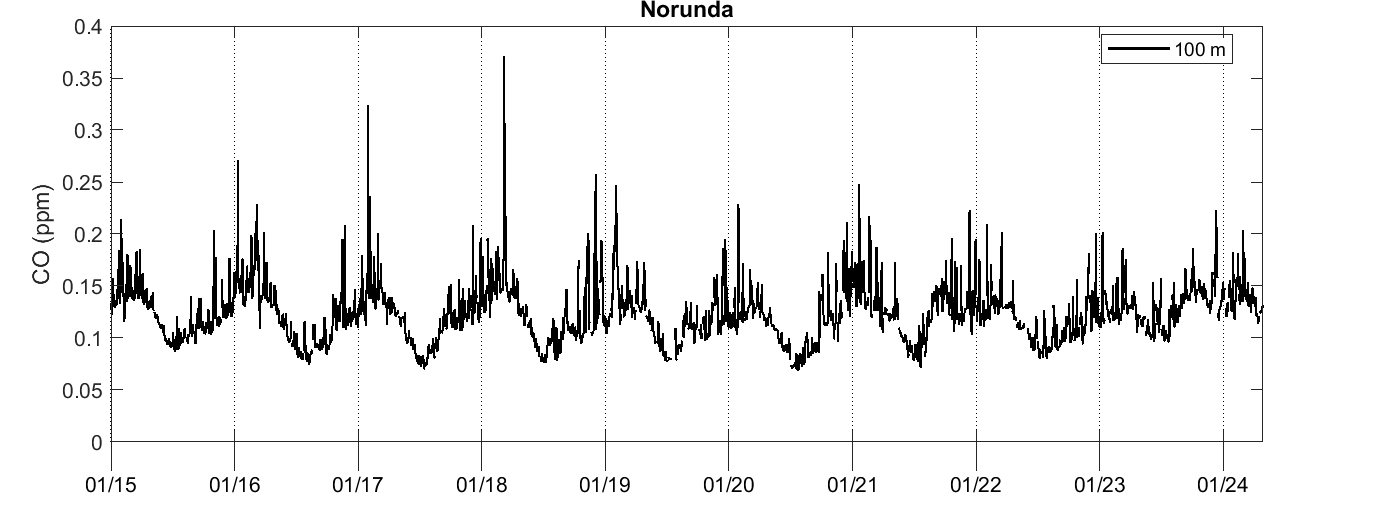
CO concentration
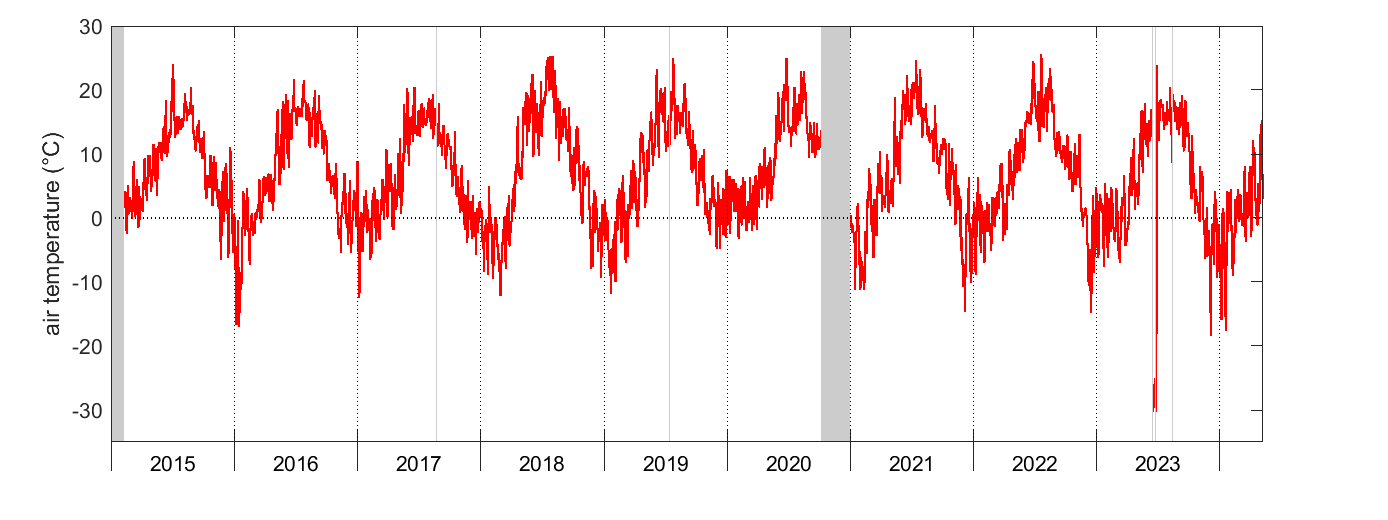
air temperature
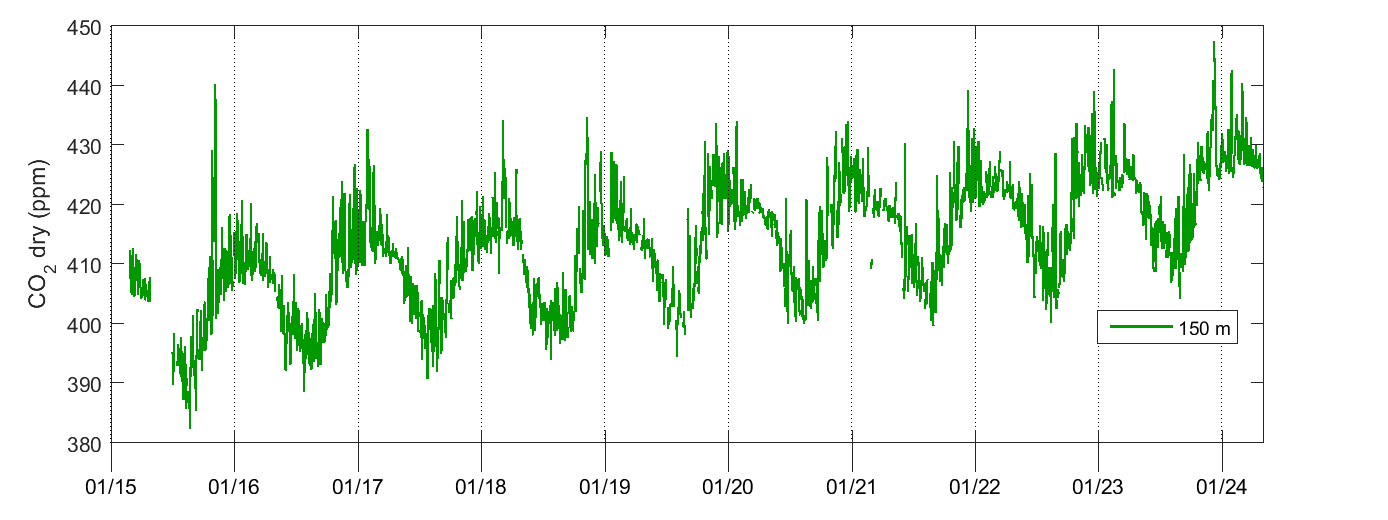
CO2 concentration
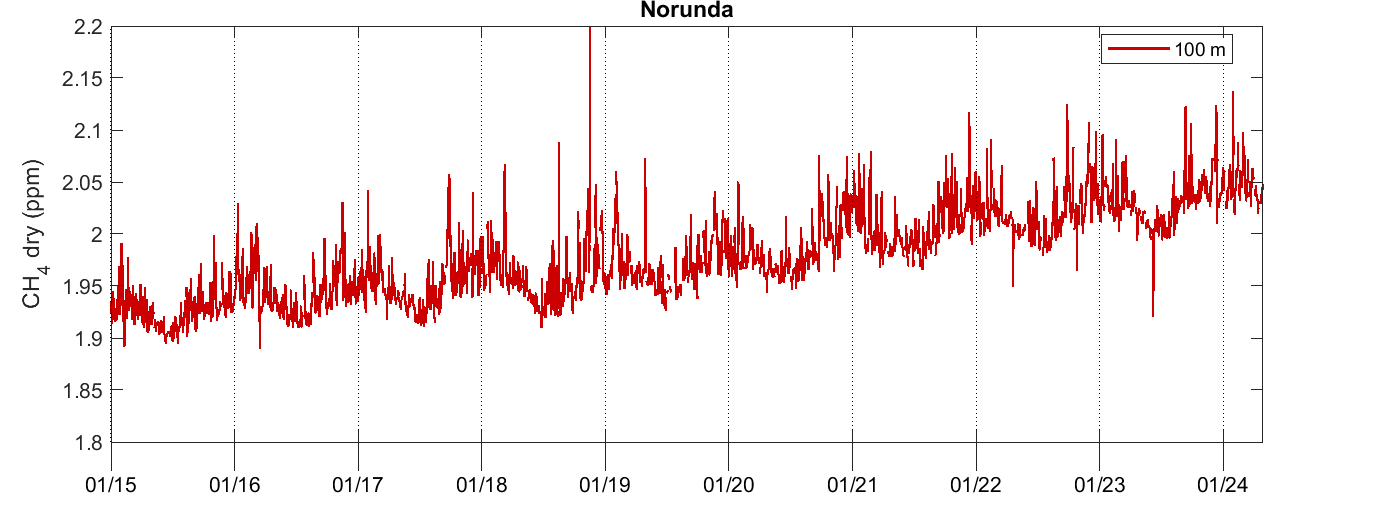
CH4 concentration
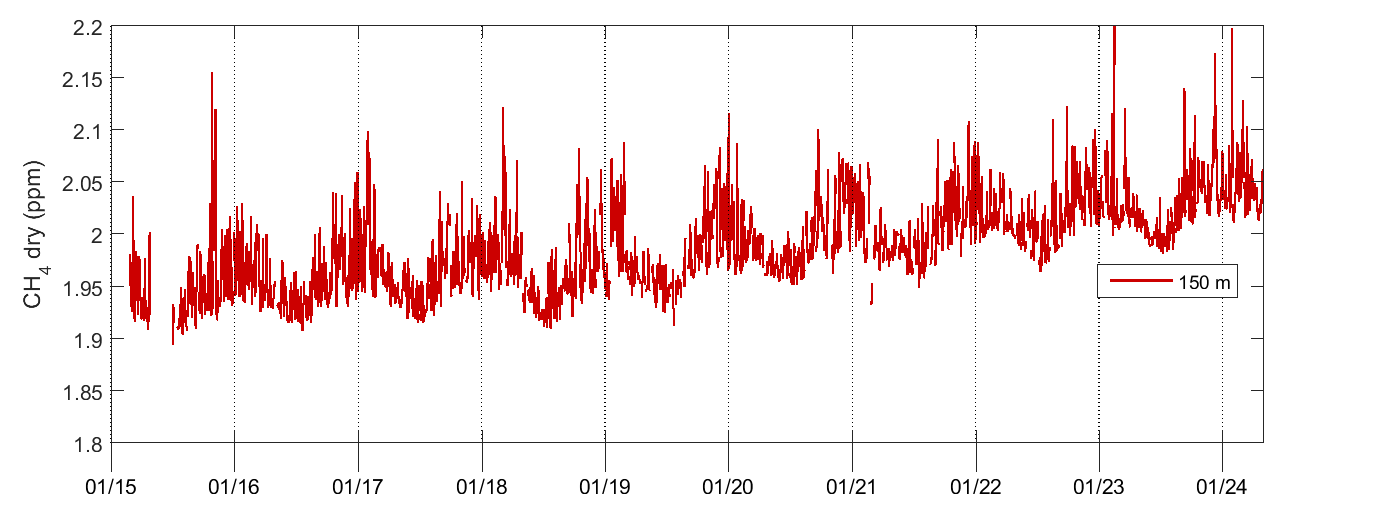
CO concentration
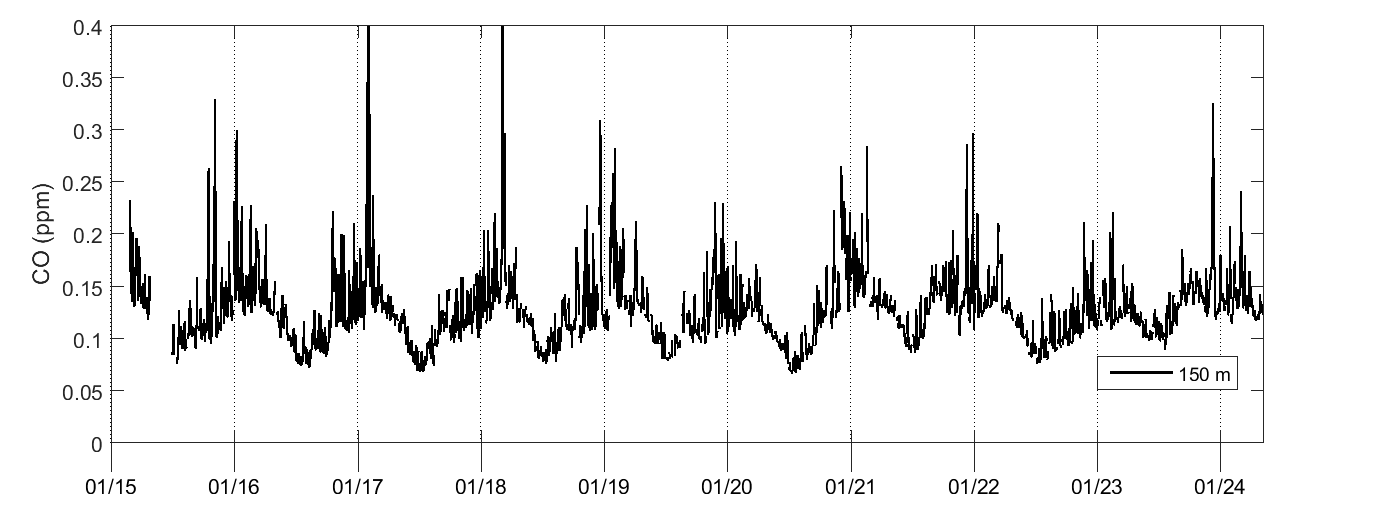
air temperature
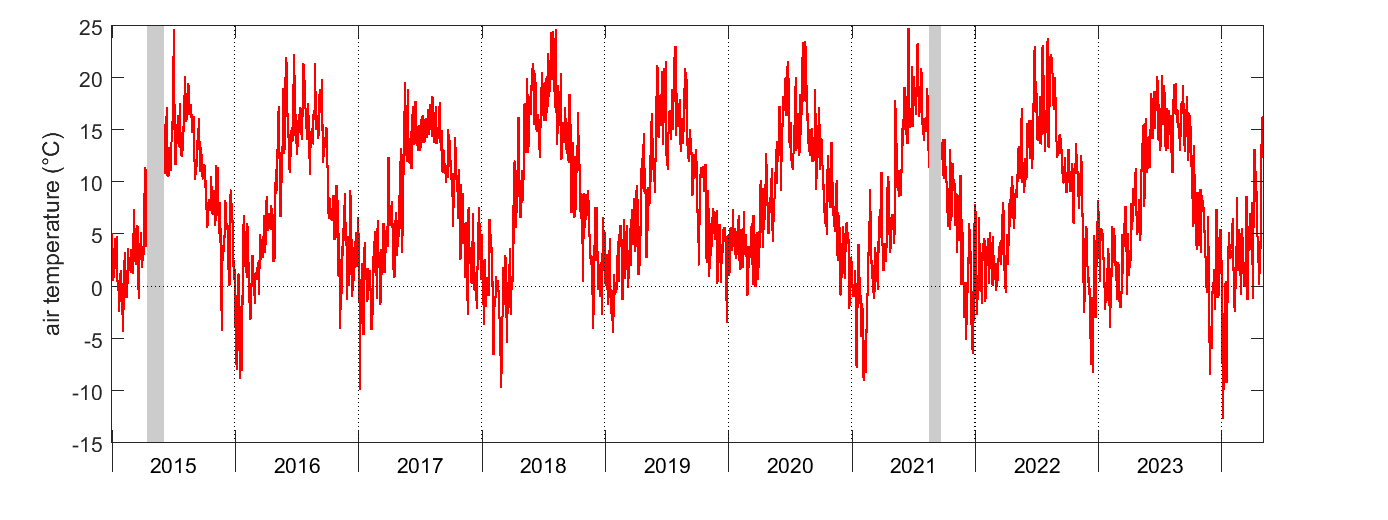
Sorted per parameter from north to south. Click on the parameter you want to see and choose time frame.
Air pressure
Stordalen

Svartberget

Degerö
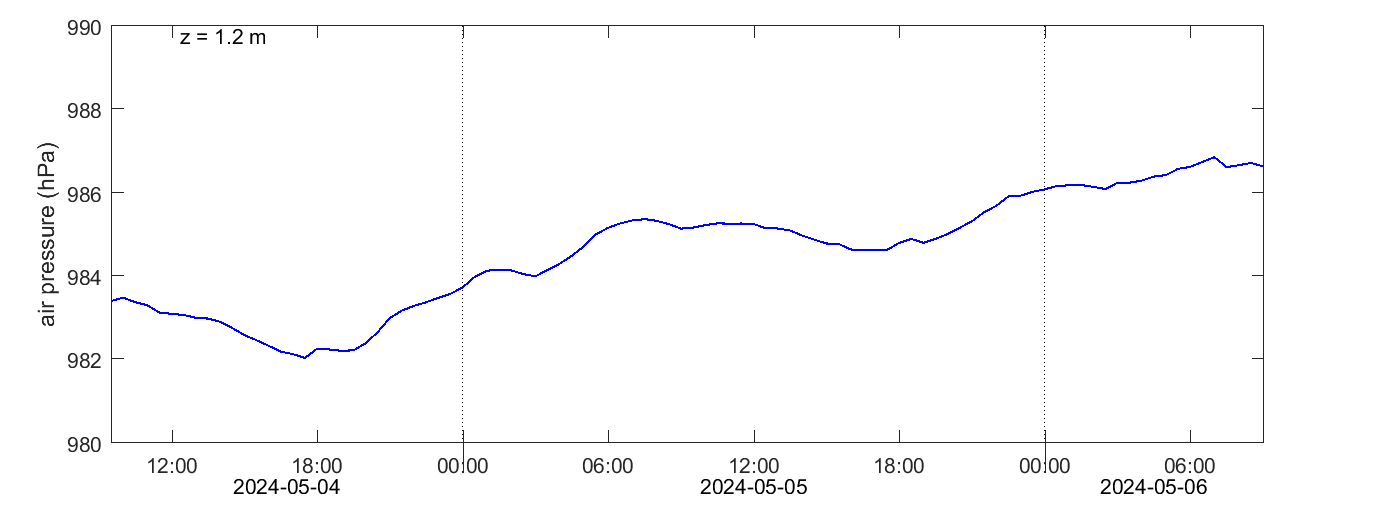
Norunda

Hyltemossa

Air temperature
Stordalen

Svartberget

Degerö

Norunda

Mycklemossen

Hyltemossa

Global radiation
Stordalen

Svartberget

Degerö

Norunda

Mycklemossen

Hyltemossa

Total precipitation
Stordalen

Svartberget

Degerö

Norunda

Mycklemossen

Hyltemossa

Relative humidity
Stordalen

Svartberget

Degerö

Norunda

Mycklemossen

Hyltemossa

Wind speed and direction
Stordalen

Svartberget

Degerö

Norunda

Mycklemossen

Hyltemossa

CO2 flux
The eddy-covariance fluxes are raw data calculated by the Swedish National Network. Data are displayed without further quality flag filtering.
Abisko-Stordalen


Svartberget

Degerö


Norunda


Mycklemossen


Hyltemossa


CH4 flux and CH4 mixing ratio
The eddy-covariance fluxes are raw data calculated by the Swedish National Network. Data are displayed without further quality flag filtering.
Abisko-Stordalen

Degerö

Mycklemossen

Methane (CH4)
Svartberget

Norunda

Hyltemossa

Carbon dioxide (CO2)
Svartberget

Norunda

Hyltemossa

Carbon monoxide (CO)
Svartberget

Norunda

Hyltemossa

Air pressure
Stordalen

Svartberget

Degerö
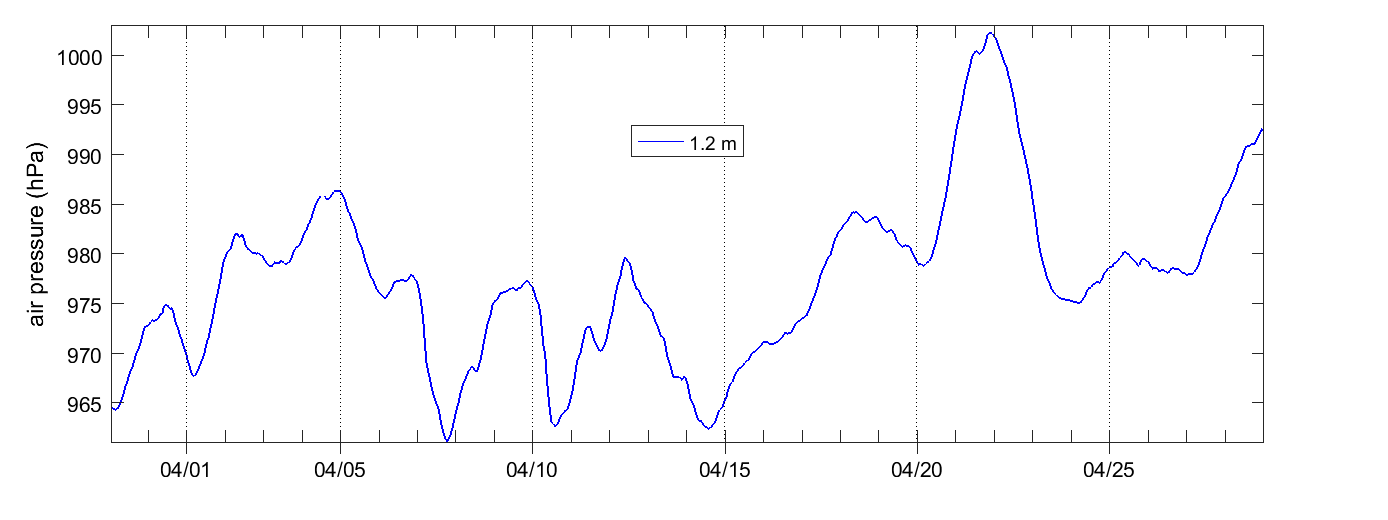
Norunda

Mycklemossen
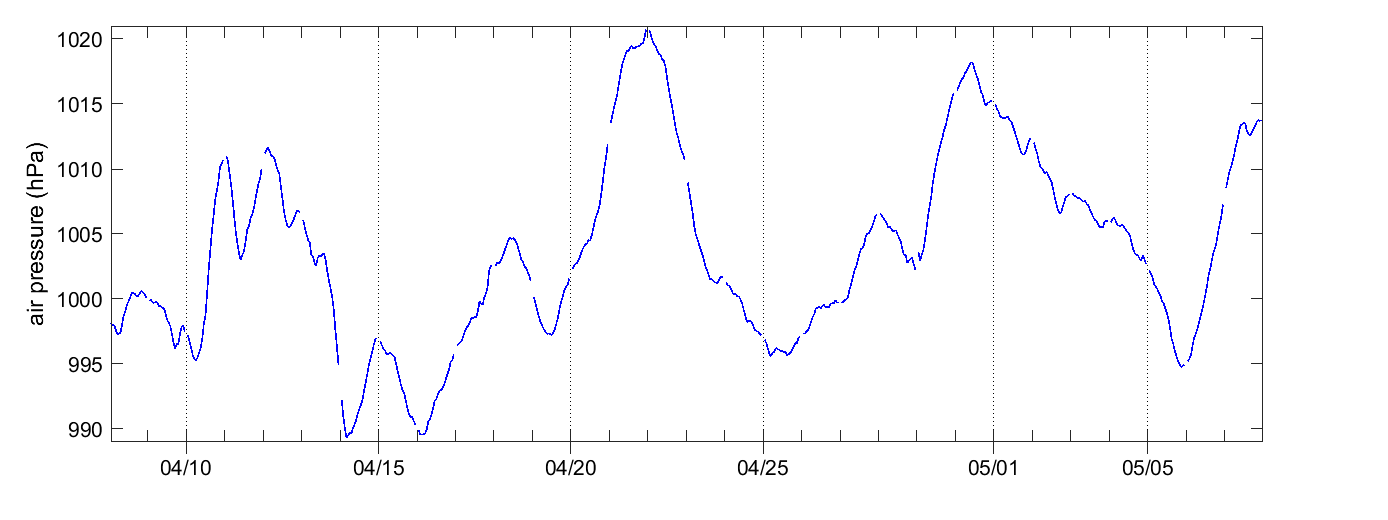
Hyltemossa

Air temperature
Stordalen

Svartberget

Degerö

Norunda

Mycklemossen

Hyltemossa

Global radiation
Stordalen

Svartberget

Degerö

Norunda

Mycklemossen

Hyltemossa

Total precipitation
Stordalen

Svartberget

Degerö

Norunda

Mycklemossen

Hyltemossa

Relative humidity
Stordalen

Svartberget

Degerö

Norunda

Mycklemossen

Hyltemossa

Wind speed and direction
Stordalen

Svartberget
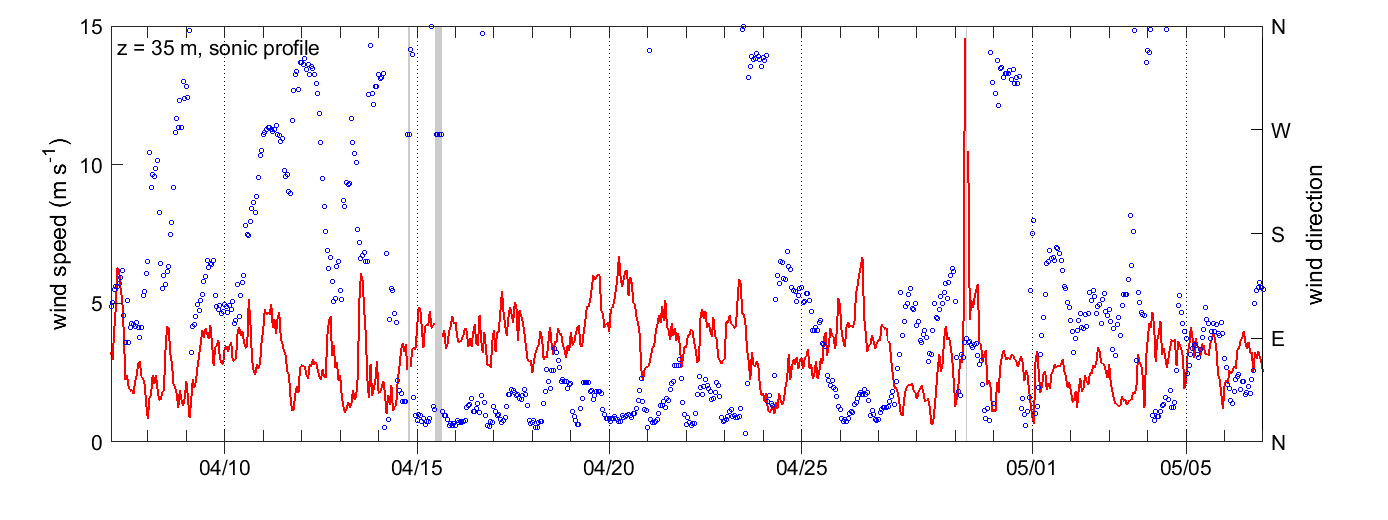
Degerö

Norunda

Mycklemossen

Hyltemossa

CO2 flux
The eddy-covariance fluxes are raw data calculated by the Swedish National Network. Data are displayed without further quality flag filtering.
The eddy-covariance fluxes are raw data calculated by the Swedish National Network. Data are displayed without further quality flag filtering.
Abisko-Stordalen


Svartberget

Degerö


Norunda


Mycklemossen


Hyltemossa


CH4 flux and CH4 mixing ratio
The eddy-covariance fluxes are raw data calculated by the Swedish National Network. Data are displayed without further quality flag filtering.
Abisko-Stordalen

Degerö

Mycklemossen

Methane (CH4)
Svartberget

Norunda

Hyltemossa

Carbon dioxide (CO2)
Svartberget

Norunda

Hyltemossa

Carbon monoxide (CO)
Svartberget

Norunda

Hyltemossa

Air pressure
Stordalen

Svartberget

Degerö
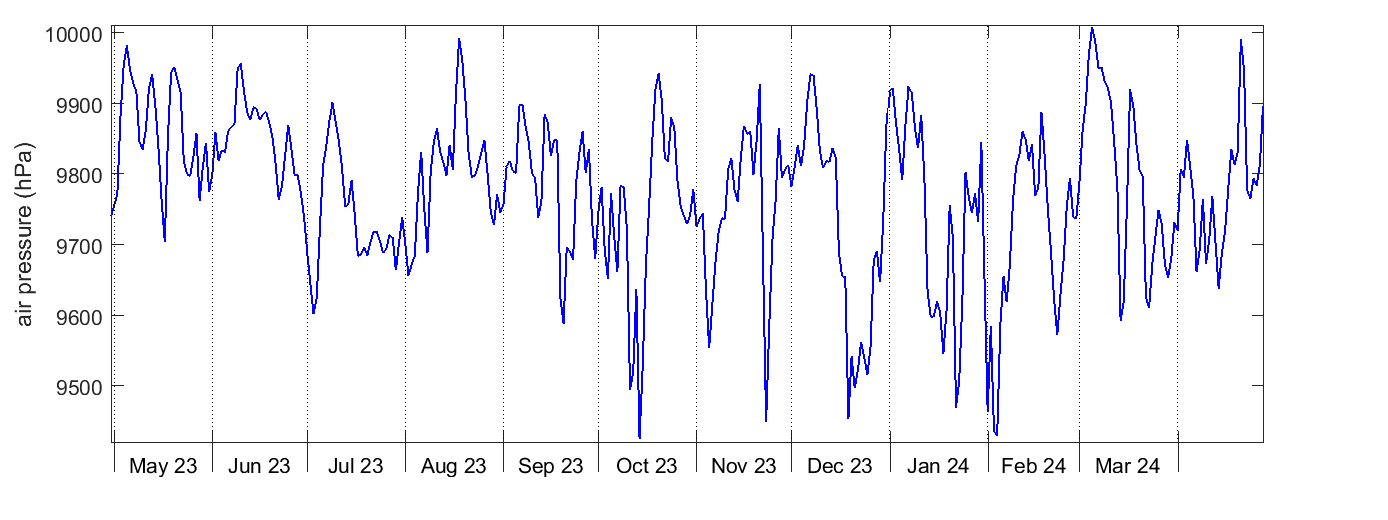
Norunda

Mycklemossen
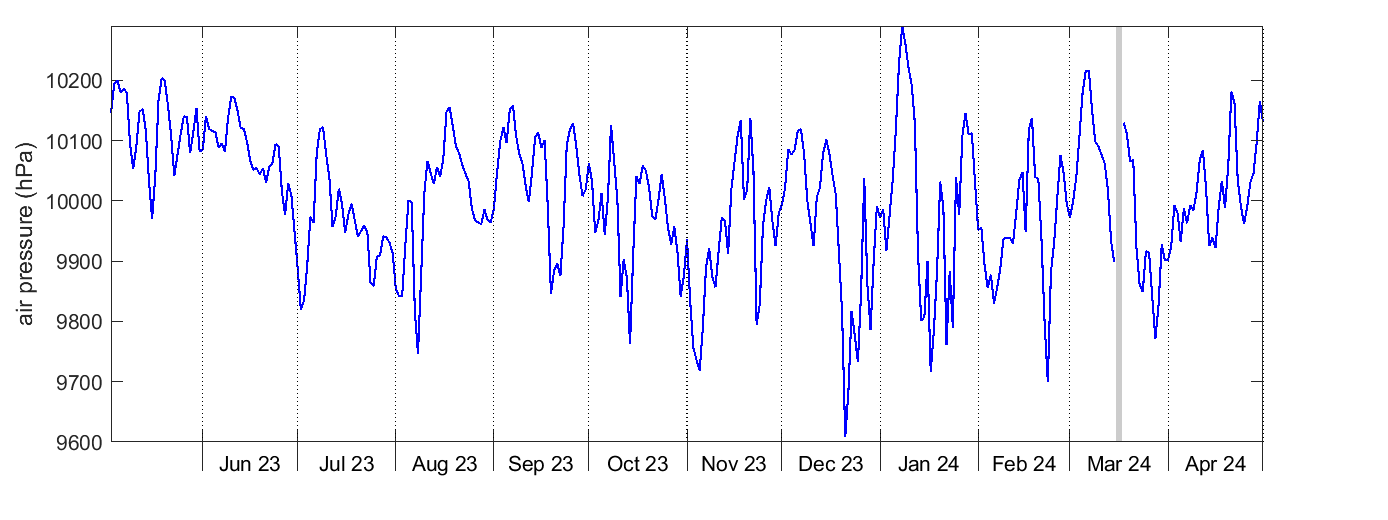
Hyltemossa

Air temperature
Stordalen

Svartberget

Degerö

Norunda

Mycklemossen

Hyltemossa

Global radiation
Stordalen

Svartberget

Degerö

Norunda

Mycklemossen

Hyltemossa

Total precipitation
Stordalen

Svartberget

Degerö

Norunda

Mycklemossen

Hyltemossa

Relative humidity
Stordalen

Svartberget

Degerö

Norunda

Mycklemossen

Hyltemossa

Wind speed and direction
Stordalen

Svartberget

Degerö

Norunda

Mycklemossen

Hyltemossa

Methane (CH4)
Svartberget

Norunda

Hyltemossa

Carbon dioxide (CO2)
Svartberget

Norunda

Hyltemossa

Carbon monoxide (CO)
Svartberget

Norunda

Hyltemossa

Methane (CH4)


Hyltemossa

Carbon dioxide (CO2)


Hyltemossa

Carbon monoxide (CO)
Hyltemossa


Air Temperature (TA)
Abisko-Stordalen

Degerö

Svartberget

Norunda

Hyltemossa

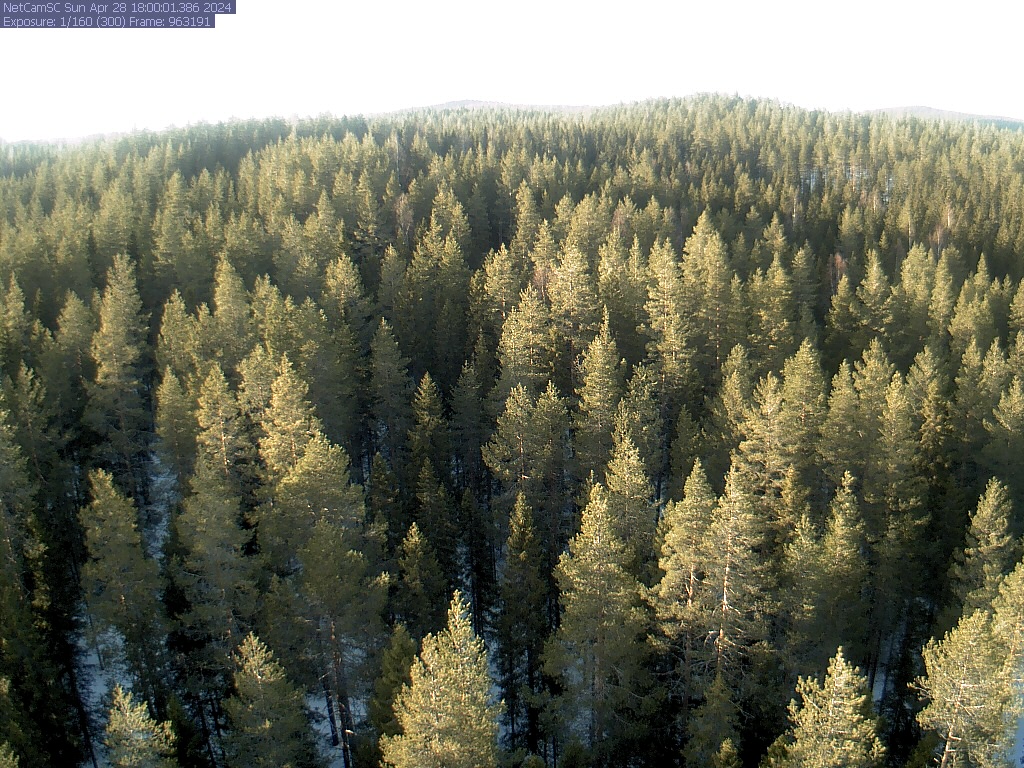
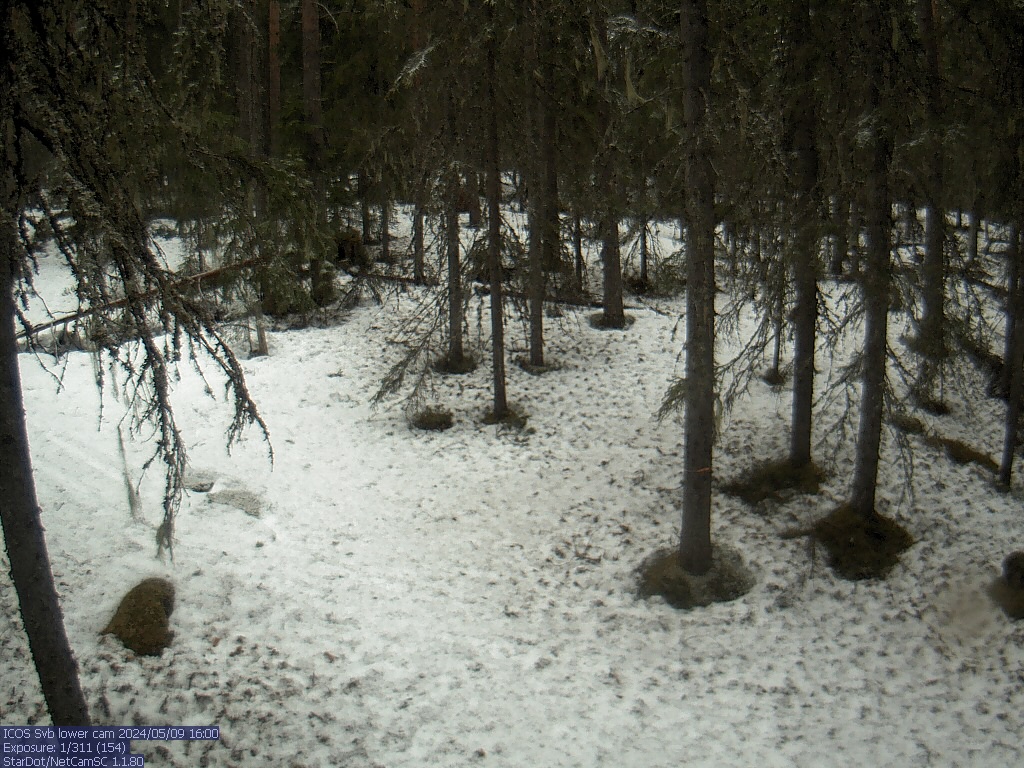
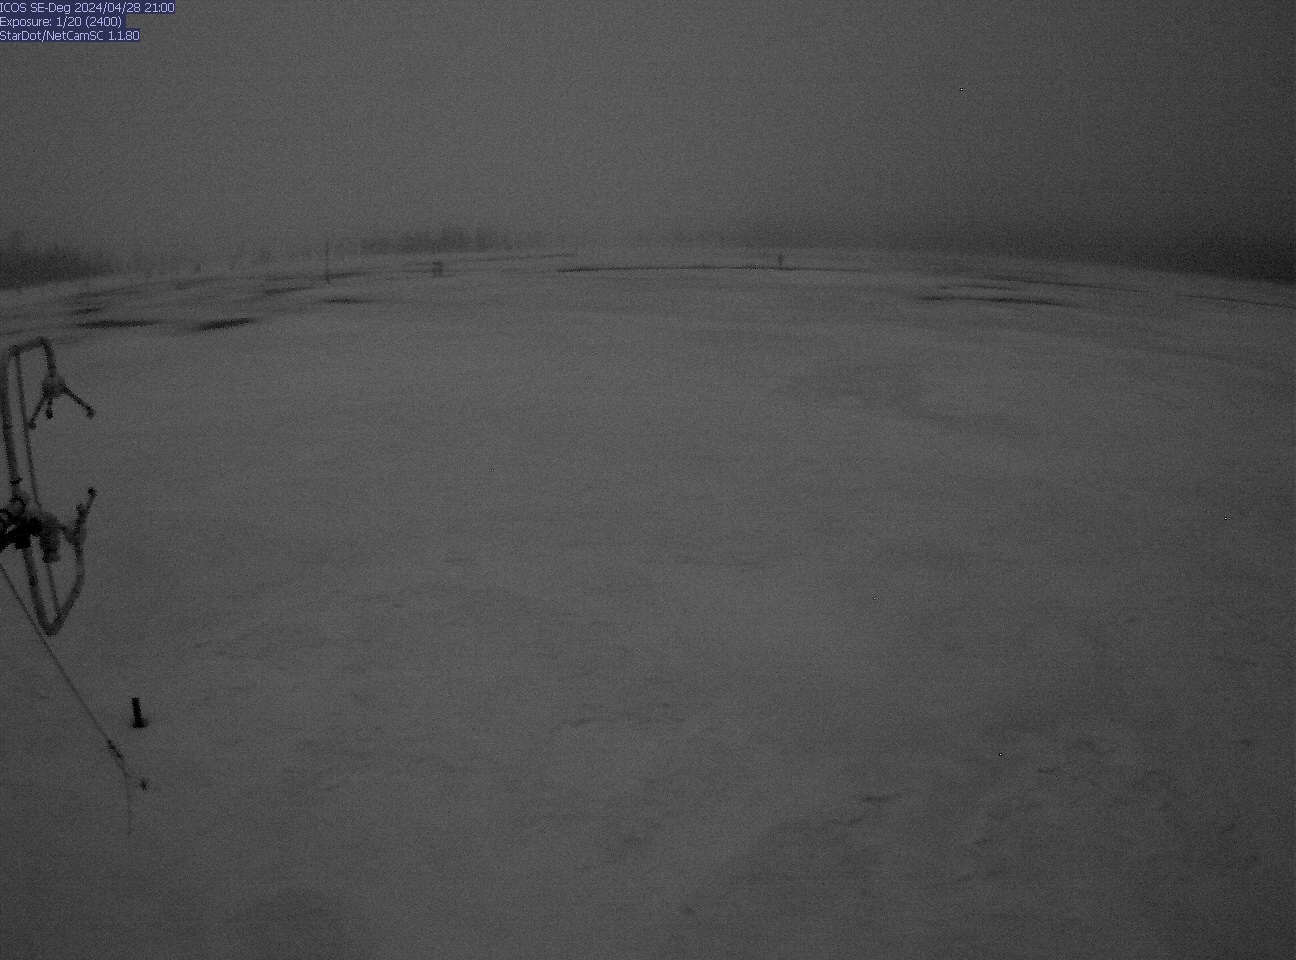
Phenocam pictures
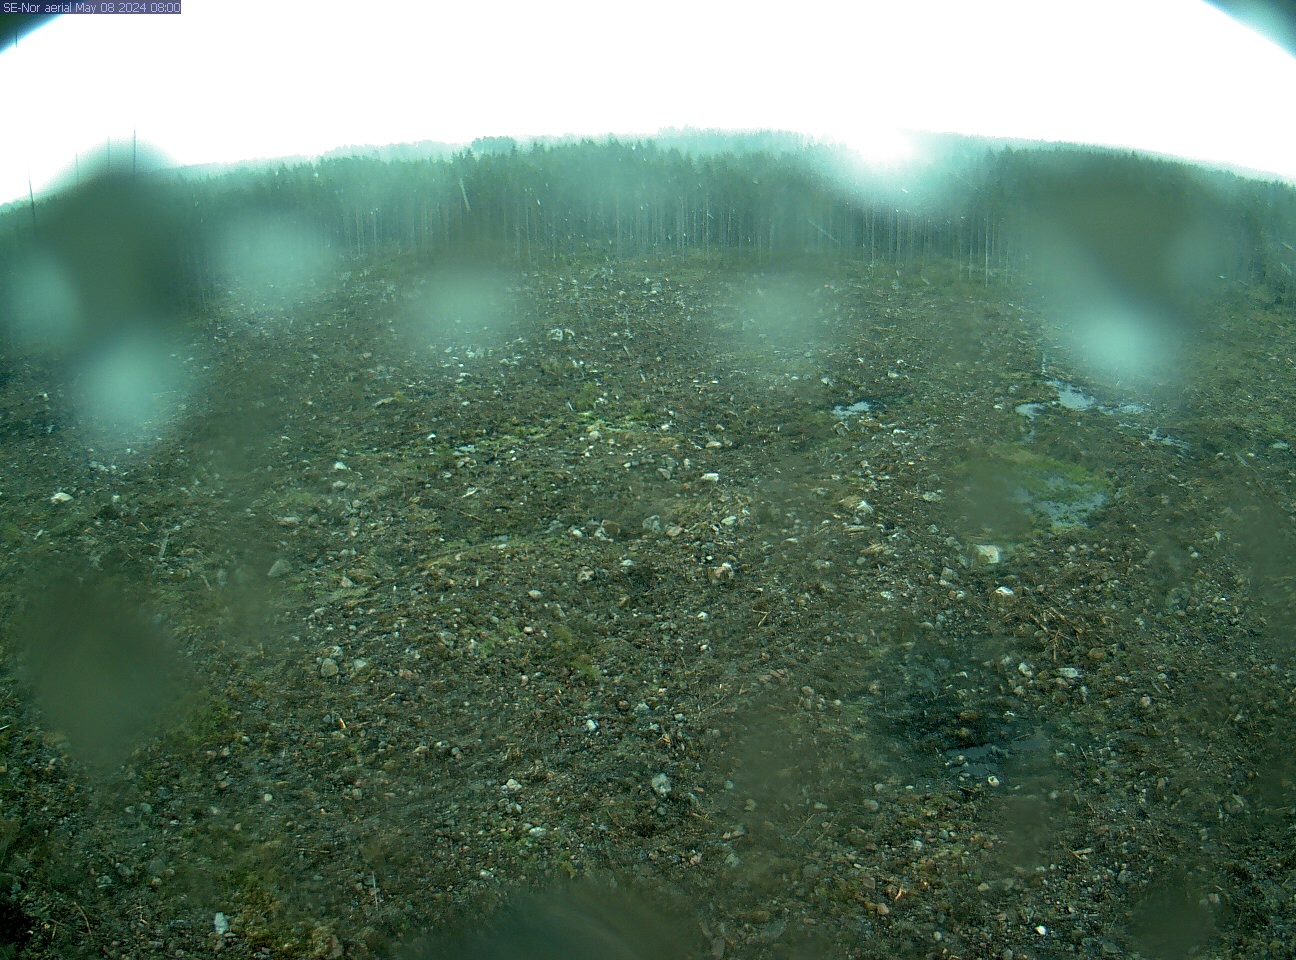
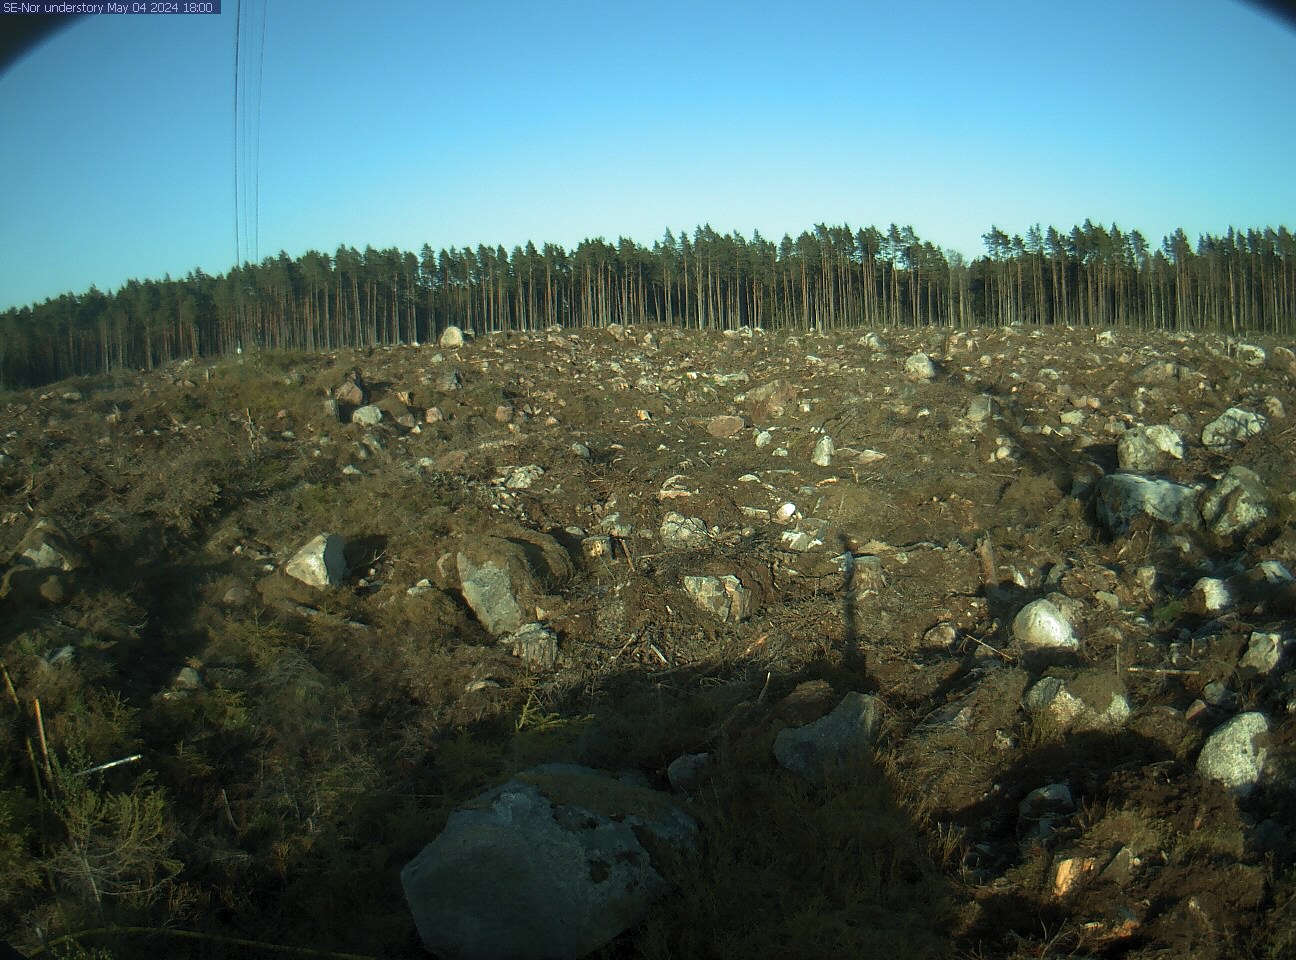
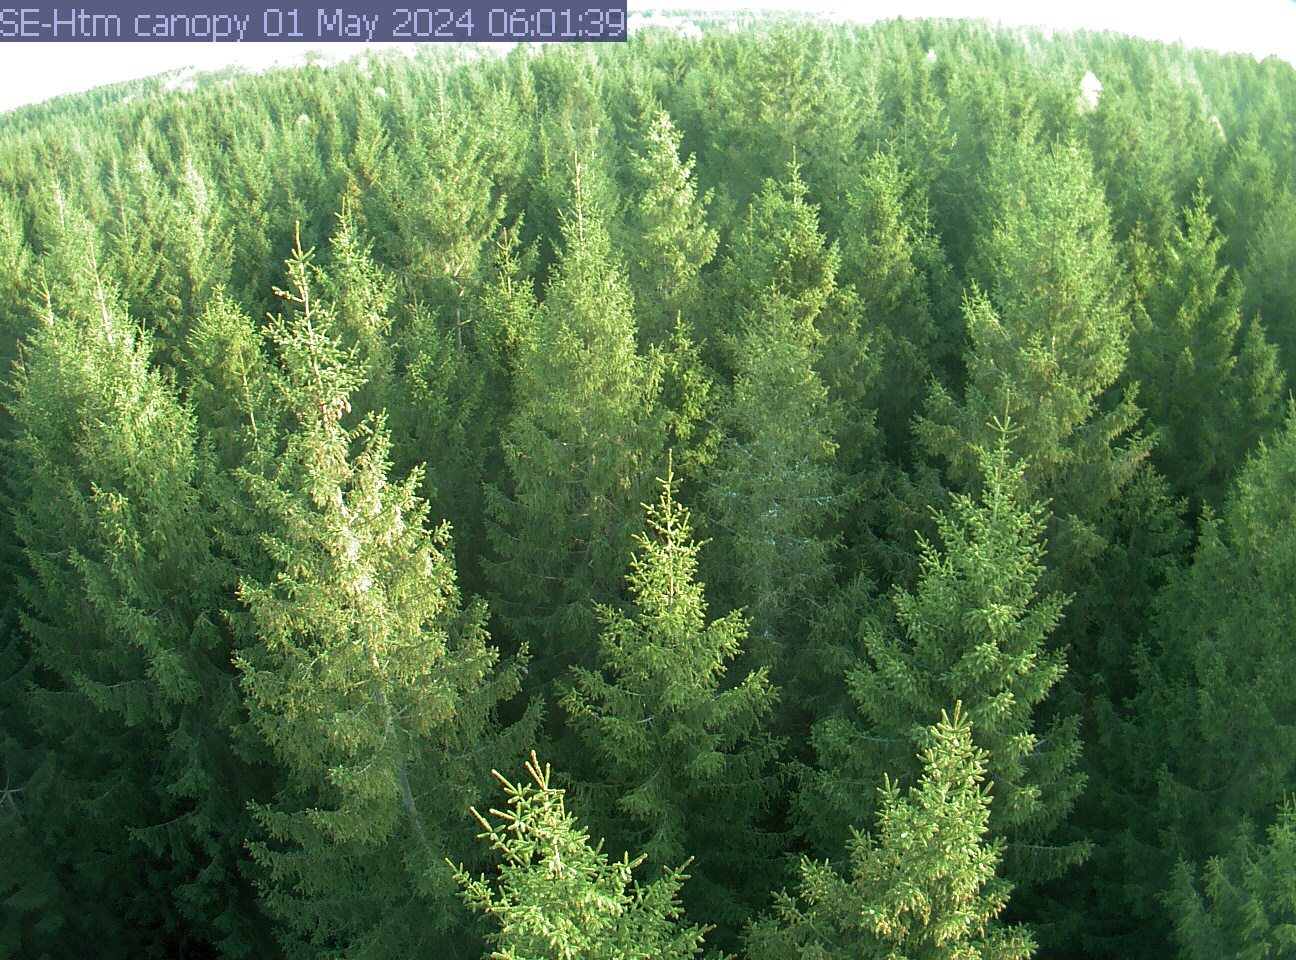
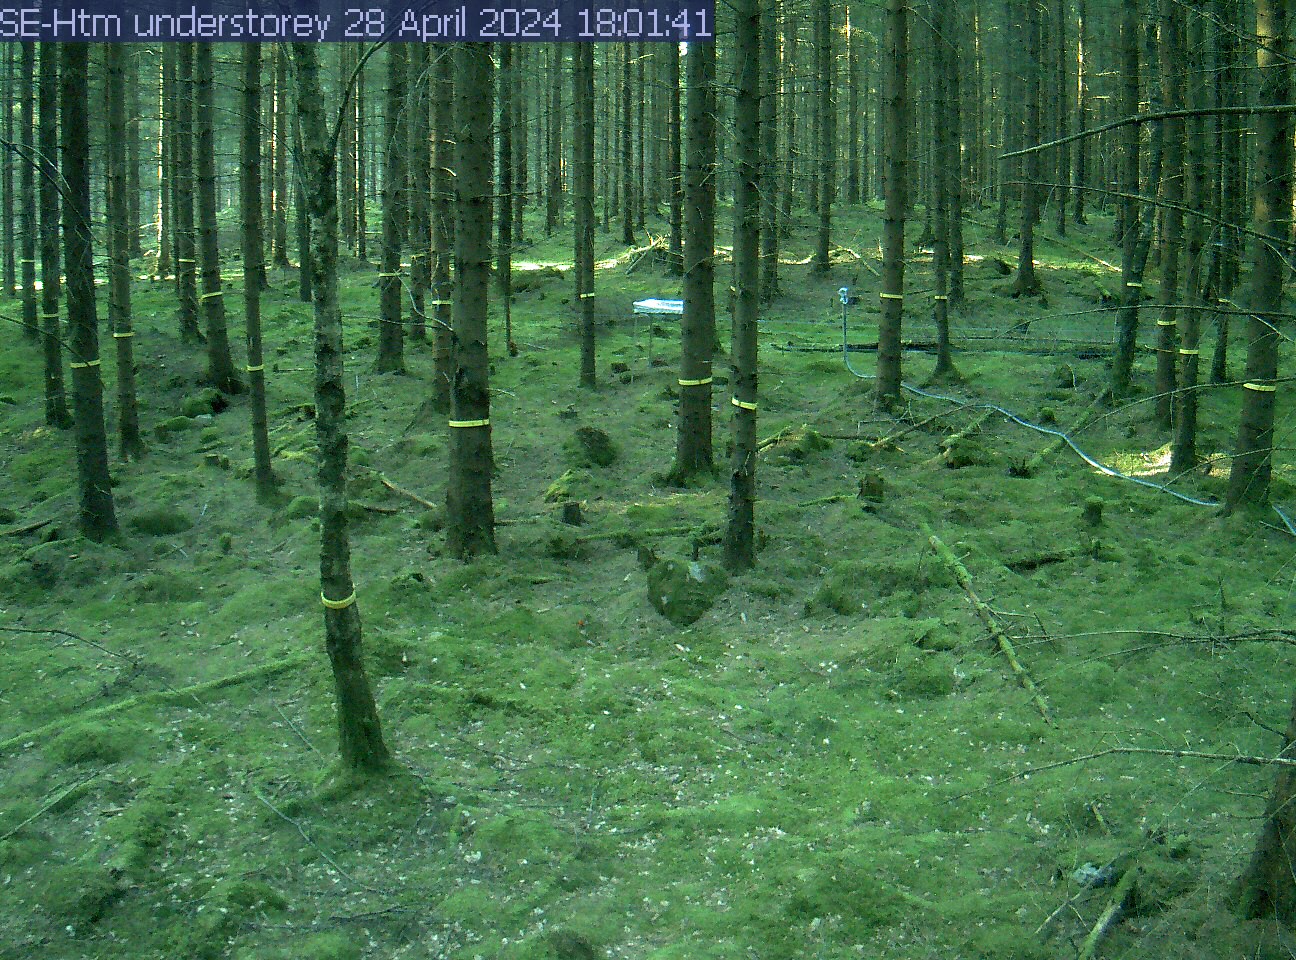
Note that the pictures of the phenocams are updated hourly during daytime. Detailed information is written on the pictures.
Abisko-Stordalen | ||
| ||
Svartberget – Above canopy | Svartberget – Below canopy | |
|
| |
Degerö | ||
| ||
Norunda – upper cam | Norunda – lower cam | |
|
| |
Hyltemossa – Above canopy | Hyltemossa – Below canopy | |
|
|
Download data
