| Location | General | Staff and Contact | Data download | Geology an soil |
| Vegetation | Climate | Measurements | Facilities | Reference |
Location
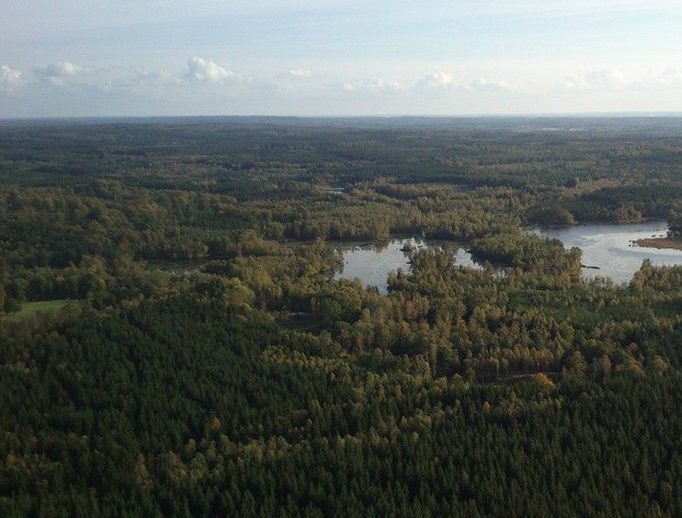
Hyltemossa is located a few kilometers south of Perstorp, in northwestern Scania (Skåne, 56.0976N, 13.4189E, 115 m a.s.l.).
General
The site Hyltemossa was established in 2014 in a managed spruce forest in southern Sweden. The site hosts a combined Atmosphere and Ecosystem station. Hyltemossa Research Station also hosts the ACTRIS Sweden station Hyltemossa operated by Lund University (Adam Kristensson) and spectral measurements within the SITES-affiliated research network NordSpec operated by Lund University (Lars Eklundh).
Hyltemossa Research station is one of the observational platforms in the ATMO ACCESS/ project giving access to researchers through TNA. Follow the weblink to read more about the rules, how to apply and access the online formular.
Staff and Contact
- Ecosystem station: PI: Michal Heliasz, Co-PI: Natascha Kljun
- Atmosphere station PI: Michal Heliasz
- station manager: Tobias Biermann
contact: hyltemossa@icos-sweden.se
Data download
Greenhouse gas related data, meteorological data and vegetation data from Hyltemossa can be downloaded from the ICOS Carbon Portal. ICOS Level2 data from the Atmosphere Station HTM (GHG concentrations, air temperature, wind). ICOS Level2 data from the Ecosystem Station SE-Htm (flux data, meteorological data, soil meteorological variables, ancillary data). ICOS Level 1 Near Realtime Data.
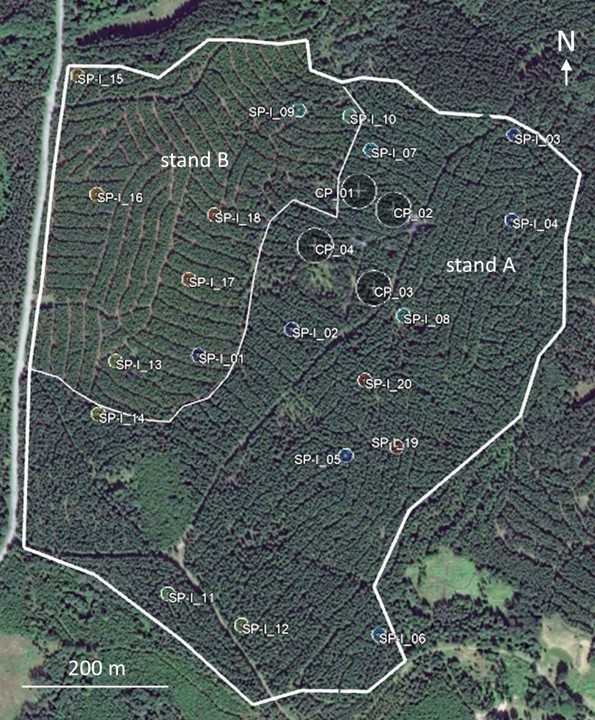
Data at the Ecosystem Station is collected at 4 continuous plots around the main measurement tower.
Aerosol data measured at Hyltemossa can be obtained from the ACTRIS data portal
Geology and Soil
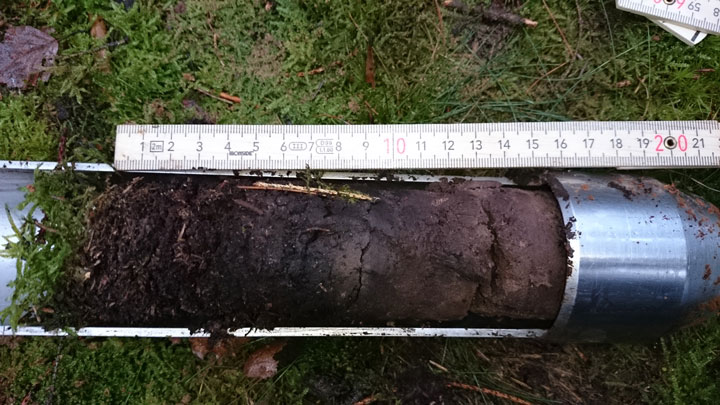
The Hyltemossa site is located on quaternary deposits, dominated by sandy till surrounded by glaciofluvial sediments. Crystalline rock and boulders can be found occasionally. The underlying bedrock is composed mainly from acidic intrusion rock such as Granite with some limited occurrence of a younger ultrabasic rock such as Gabbro.
Soil at the site is classified as Cambisol with a shallow organic horizon, a transition to Podsol can be found in certain areas. Stones in various sizes are found frequently and in some areas influence of groundwater is obvious in 1 m depth.
Vegetation
The site around the tower is dominated by Norway spruce (Picea abies) with a small fraction of birch trees (Betula sp.) and single occurrence of Scots pine (Pinus sylvestris). Understorey vegetation is sparse. The forest floor is mainly covered by a thick moss layer.
The forest is owned and managed by Gustafsborg Säteri AB (www.gustafsborg.se). The management turnover rate is 50 years, with an estimated growth of 34 m within 100 years. The site experienced storm damage in 1981, was clear-cut in 1982 and replanted in two stages 1983 with 3300 trees per hectare in plot A and in 1988 in plot B. The forest was cleaned in 1998 and 2005 and thinned in 2009 and 2013.
Follow this link to access the full ancillary data report of Hyltemossa provided by the ICOS ETC.
Click here to see a satellite image time lapse 1984-2016 on Google Earth Engine.
overstory species composition (last inventory: 2018) | |||
|---|---|---|---|
| species | trees/ha | percentage | Basal Area (m2/ha) |
| all trees | 611.2 | 100 | 14.048 |
| Picea Abies L. | 597 | 97.7 | 13.775 |
| Betula pendula Roth. | 10.6 | 1.7 | 0.224 |
| Betula pubescens Ehrh. | 2.8 | 0.5 | 0.04 |
| Pinus sylvestris L. | 0.7 | 0.1 | 0.01 |
main tree species characteristics (last inventory: 2022) | |||||
|---|---|---|---|---|---|
| species | plot | DBH1 (cm) | σDBH (cm) | height (m) | σheight (m) |
| Picea abies L. | CP1 | 20.5 | 5.5 | 15.6 | 2.9 |
| CP2 | 20.8 | 5.5 | 18.9 | 3.6 | |
| CP3 | 23.1 | 6.2 | 19.7 | 3.6 | |
| CP4 | 21.4 | 5.4 | 18.5 | 3.0 | |
| Stand A (SP) | 22.5 | 5.8 | 19.4 | 4.6 | |
| Stand B (SP) | 14.5 | 4.7 | 13.5 | 4.1 | |
| Betula pendula Roth. | CP1 | 14.6 | 4.5 | 15.3 | 5.3 |
| CP2 | 15.0 | 6.7 | 14.6 | 6.0 | |
| CP3 | 12.1 | 6.0 | 13.7 | 5.4 | |
| CP4 | 16.5 | 4.3 | 17.1 | 3.7 | |
| Stand A (SP) | 15.4 | 6.2 | 13.2 | 6.9 | |
| Stand B (SP) | 11.6 | 3.0 | 10.2 | 5.9 | |
1DBH: measured at 1.3 m, minimum diameter: 5 cm
overstory GREEN area index2 | ||||
|---|---|---|---|---|
| date | mean GAI (m2/m2) | standard deviation (m2/m2) | clumping factor | |
| 2018 | May | 3.93 | 0.47 | 0.91 |
| Jul | 4.21 | 0.28 | 0.91 | |
| Sep | 4.53 | 0.35 | 0.91 | |
| Oct | 4.32 | 0.50 | 0.91 | |
| Nov | 4.48 | 0.53 | 0.90 | |
| 2019 | Feb | 4.31 | 0.52 | 0.90 |
| May | 4.34 | 0.34 | 0.92 | |
| Jun | 4.40 | 0.40 | 0.91 | |
| Jul | 4.53 | 0.48 | 0.91 | |
| Sep | 4.51 | 0.57 | 0.91 | |
| Nov | 4.44 | 0.50 | 0.91 | |
| Dec | 4.36 | 0.50 | 0.92 | |
| 2020 | Apr | 4.14 | 0.54 | 0.91 |
| Jun | 4.45 | 0.52 | 0.90 | |
| Jul | 4.66 | 0.45 | 0.92 | |
| Sep | 4.66 | 0.49 | 0.91 | |
| Dec | 4.71 | 0.55 | 0.90 | |
| 2021 | Apr | 4.29 | 0.37 | 0.92 |
| Jun, 15 | 4.92 | 0.52 | 0.91 | |
| Jun, 27 | 4.77 | 0.45 | 0.91 | |
| Sep | 4.39 | 0.59 | 0.95 | |
| Nov | 4.18 | 0.50 | 0.95 | |
| 2022 | Feb | 3.91 | 0.50 | 0.95 |
| Jun | 4.08 | 0.43 | 0.95 | |
| Jul | 4.37 | 0.64 | 0.95 | |
| Sep | 3.98 | 0.50 | 0.95 | |
| 2023 | Apr | 4.10 | 0.61 | 0.95 |
| Jun | 4.36 | 0.52 | 0.95 | |
| Jul | 4.31 | 0.63 | 0.95 | |
| Dec | 4.01 | 0.58 | 0.95 | |
2approach: up to 13 DHP pictures were taken in each of 4 continuous plots . LAI was calculated at each location (9 per plot) and averaged per plot. Only QC checked pictures were included. For each CP 7 or more pictures should be suitable to include plot in aggregation.
Foliar analyses, Picea abies L. | ||||||||
|---|---|---|---|---|---|---|---|---|
| parameter | 02/2018 | 01/2019 | 12/2019 | 12/2020 | 12/2021 | 11/2022 | 12/2023 | 11/2024 |
| Ca (g/kg) | 3.01 | 2.41 | 5.14 | 3.39 | 3.07 | 3.16 | 3.02 | 3.83 |
| Cu (mg/kg) | 2.16 | 2.08 | 2.21 | 2.42 | 1.86 | 2.16 | 2.48 | 2.47 |
| Fe (mg/kg) | 28.06 | 19.87 | 26.11 | 21.55 | 19.03 | 15.43 | 17.89 | 21.95 |
| Mg (g/kg) | 1.10 | 1.06 | 1.10 | 1.12 | 1.12 | 1.04 | 1.13 | 1.21 |
| Mn (mg/kg) | 352.5 | 311.8 | 679.4 | 326.8 | 301.7 | 225.8 | 339.0 | 544.1 |
| C (g/kg) | 512.1 | 516.2 | 515.8 | 517.8 | 512.7 | 511.7 | 514.5 | 514.2 |
| N (g/kg) | 14.28 | 13.58 | 14.73 | 15.66 | 14.89 | 14.22 | 14.29 | 14.28 |
| P (g/kg) | 1.21 | 1.19 | 1.02 | 1.28 | 1.24 | 1.18 | 1.29 | 1.32 |
| K (g/kg) | 4.01 | 5.17 | 4.24 | 6.06 | 5.40 | 6.10 | 5.52 | 6.10 |
| Zn (mg/kg) | 18.64 | 19.10 | 42.4 | 23.3 | 20.28 | 21.68 | 20.96 | 24.65 |
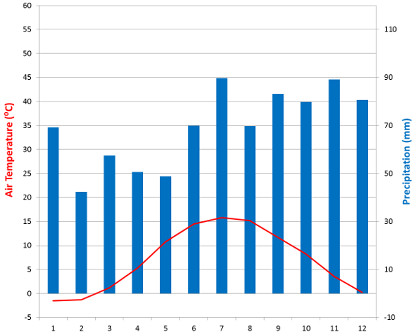
Climate
Data for the 1961-1990 climatological normal from the close by SMHI station Ljungbyhed characterizes the climate as a Cfb-climate (after Köppen), i.e. humid temperate with mild summers and mild winters. Mean annual air temperature for Ljungbyhed is 7°C and mean annual precipitation sums up to 830 mm.
Measurements
The measurements are carried out either on the 150 m high tower, at the earth surface, or in a soil pit and on a tree in one of the four continuous measurement points located around the tower. All measurements are carried out within a distance of about 200 m of the tower.
Measured Atmosphere station variables
Variables and measurement heights included in the Atmosphere station program at Hyltemossa are listed on the Atmosphere station introduction page: follow this link to the page
Measured Ecosystem station variables and summary of station parameters
Variables and measurement heights included in the Ecosystem station program at Hyltemossa are listed on the Ecosystem station introduction page: follow this link to the page
Non-ICOS measurements
The research station Hyltemossa hosts an ACTRIS Sweden station and spectral measurements for calculation of the vegetation indices PRI and NDVI from the SITES-associated network NordSpec. Hyltemossa also hosts air pollution background measurements (NOx) for Malmö city (see data here) as well as other complementary measurements from researchers who use the site for their own projects (e.g. BVOC (PTR-TOF) and O3
concentrations or measurements of sun induced fluorescence and reflectance using a FLOX system).
Facilities
The station provides mains power and internet via radiolink, and offers an office building including a seminar room (up to 20 persons) as well as accommodation (10 beds in 4 rooms; full kitchen; toilet & shower). In the forest, there is a laboratory building including workshop providing space for guests to deploy instrumentation in a separate room (15m2), and a smaller laboratory building (25m2) run by ACTRIS in a nearby forest clearing.
References
- Levin, I., Karstens, U., Eritt, M., Maier, F., Arnold, S., Rzesanke, D., Hammer, S., Ramonet, M., Vitková, G., Conil, S., and others 2020. A dedicated flask sampling strategy developed for Integrated Carbon Observation System (ICOS) stations based on CO 2 and CO measurements and Stochastic Time-Inverted Lagrangian Transport (STILT) footprint modelling. Atmospheric Chemistry and Physics, 20(18), p.11161–11180.
- Lindroth, A., Holst, J., Linderson, M.L., Aurela, M., Biermann, T., Heliasz, M., Chi, J., Ibrom, A., Kolari, P., Klemedtsson, L., and others 2020. Effects of drought and meteorological forcing on carbon and water fluxes in Nordic forests during the dry summer of 2018. Philosophical Transactions of the Royal Society B, 375(1810), p.20190516.
- Yver-Kwok, C., Philippon, C., Bergamaschi, P., Biermann, T., Calzolari, F., Chen, H., Conil, S., Cristofanelli, P., Delmotte, M., Hatakka, J., and others 2021. Evaluation and optimization of ICOS atmosphere station data as part of the labeling process. Atmospheric Measurement Techniques, 14(1), p.89–116.
ICOS ETC labelling report: